| View previous topic :: View next topic |
| Author |
bharat forg ------- which pattern is this ? |
chiragbvyas
White Belt

Joined: 18 Feb 2010
Posts: 469
|
Post: #1  Posted: Fri Jul 29, 2011 7:16 pm Post subject: bharat forg ------- which pattern is this ? Posted: Fri Jul 29, 2011 7:16 pm Post subject: bharat forg ------- which pattern is this ? |
 |
|
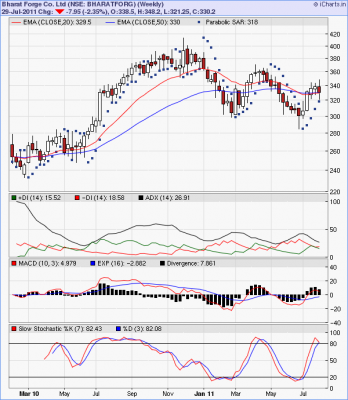
after shorted at 336 and covered at 329.65 some interesting patterns are found in the chart of bharat forg.
though i dont know and understand what is it called but would like to short it again around 320 if go below support line then could have good profit. but could not identify stoploss.
expert opinion wel come.
Regards.
Chirag B.Vyas
| Description: |
|
| Filesize: |
12.53 KB |
| Viewed: |
541 Time(s) |
|
|
|
| Back to top |
|
 |
|
| |
ANS_KOL
White Belt
Joined: 16 Jul 2011
Posts: 84
|
| Post: #2 Posted: Fri Jul 29, 2011 11:08 pm Post subject: |
|
|
DEAR CHIRAG,
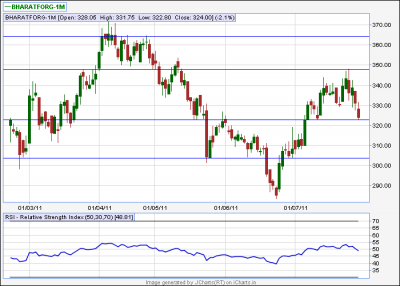
yes 320 level is veru crucial for this stock, as that is the point from where the neckiline of a reverse head and shoulder pattern in short term chart is broken, and the stock has given a smart ralley all the way to 342.
and if one draw a downward trendline from the april top of 370, the opposite side of that broken trendline( which is broken at the same time with the break of head and shoulder neckline.) lying currently at 315-320 level.
moreover, the intermediate term moving averages are providing suport near 318-320 level. without immense selling pressure it is of least possibility that bharatforg will break down below 320.more possibility of it testing 340 level once again.
if 320 broken 300 can be tested, stoploss will be 332, where the short term upward trendline was broken.
regars.
ANS.
|
|
| Back to top |
|
|
bull4me
White Belt
Joined: 02 Feb 2010
Posts: 11
|
|
| Back to top |
|
|
bull4me
White Belt
Joined: 02 Feb 2010
Posts: 11
|
| Post: #4 Posted: Sat Jul 30, 2011 1:39 pm Post subject: |
|
|
| Please do share your thoughts on the same!!!
|
|
| Back to top |
|
|
nsinojia
Yellow Belt

Joined: 21 Dec 2009
Posts: 624
|
| Post: #5 Posted: Sat Jul 30, 2011 5:57 pm Post subject: |
|
|
| bull4me wrote: | | Please do share your thoughts on the same!!! |
bearish engulfing on26th july ..and 50sma support at 317 if breach eod it may lead prices to 285 
|
|
| Back to top |
|
|
|
|
You cannot post new topics in this forum
You cannot reply to topics in this forum
You cannot edit your posts in this forum
You cannot delete your posts in this forum
You cannot vote in polls in this forum
You can attach files in this forum
You can download files in this forum
|
Powered by phpBB © 2001, 2005 phpBB Group
|
|