| View previous topic :: View next topic |
| Author |
Breakout/ Breakdown Trades |
aromal
White Belt

Joined: 22 Mar 2010
Posts: 302
|
Post: #16  Posted: Thu Jul 22, 2010 8:23 pm Post subject: Re: ADANI POWER Posted: Thu Jul 22, 2010 8:23 pm Post subject: Re: ADANI POWER |
 |
|
| sumesh_sol wrote: | Here is ASCENDING triangle pattern in making. It has NOT yet broken, but I believe if broken on high side, can take it higher (Tgts I don't know !!).
Moreover, Chrome please tell whether we should wait for the EOD CLOSING above BO point , or just keep limit order above resistance line.?
Regards,
Sumesh |
hi sumesh its terrific triankle...... am only worried about 5441....... i expect a fall these day..... but adani power perfect triankle
|
|
| Back to top |
|
 |
|
|
|
shekharinvest
Yellow Belt

Joined: 21 Dec 2007
Posts: 549
|
| Post: #17 Posted: Fri Jul 23, 2010 8:22 am Post subject: |
|
|
Hi,
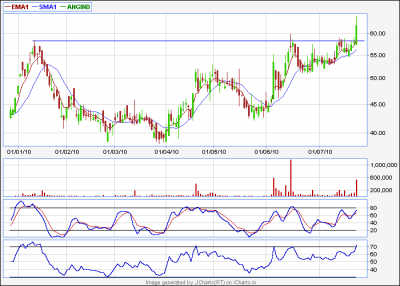
Just have a look this is an EOD chart.
ANGIND has given a BO also it has formed a C&H formation it may TGT approx 75-80.
SHEKHAR
| Description: |
|
| Filesize: |
15.09 KB |
| Viewed: |
716 Time(s) |
|
|
|
| Back to top |
|
|
chrome
Yellow Belt
Joined: 28 Dec 2009
Posts: 645
|
| Post: #18 Posted: Fri Jul 23, 2010 9:50 am Post subject: |
|
|
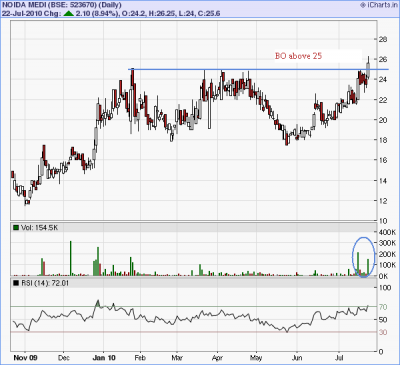
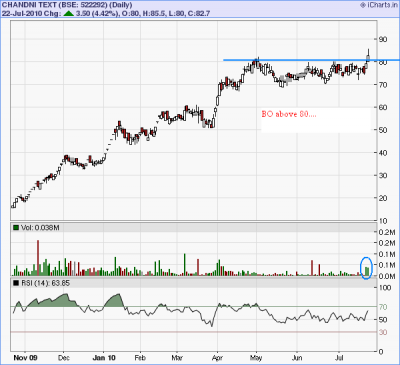
Quick charts-----
NOIDA MEDI - BO above 25
CHANDNI TEXT - BO above 80
| Description: |
|
| Filesize: |
17.32 KB |
| Viewed: |
661 Time(s) |
|
| Description: |
|
| Filesize: |
27.89 KB |
| Viewed: |
668 Time(s) |
|
|
|
| Back to top |
|
|
sumesh_sol
Brown Belt

Joined: 06 Jun 2010
Posts: 2344
|
| Post: #19 Posted: Fri Jul 23, 2010 3:42 pm Post subject: |
|
|
Hi Karman, Chrome
I have not yet closed the trade. can u suggest SL for this (EOD basis).
Regards,
Sumesh
| karman1990 wrote: | | chrome wrote: | | karman1990 wrote: | | sumesh_sol wrote: | Hi Chrome,
I just entered Unitech @86.15. What is your appx. Tgt..?
Regards,
Sumesh
| chrome wrote: | | karman1990 wrote: | | breakout in unitech....weekly TF. |
Hi Karman,
Nice Unitech chart u posted !
UNITECH is also making very beautiful Cup & Handle formation on EOD charts. Also, 86 will be a breakout point for the scrip. Hope, above 86 it will fly  |
|
90/92 may possible. |
Hi Sumesh/ Karman..yes 90-95 zone immediate target for Unitech above 86 as per me  |
why did'nt you give the bbtc chart earlier....superb breakout... |
|
|
| Back to top |
|
|
sumesh_sol
Brown Belt
Joined: 06 Jun 2010
Posts: 2344
|
| Post: #20 Posted: Fri Jul 23, 2010 9:12 pm Post subject: |
|
|
Hi,
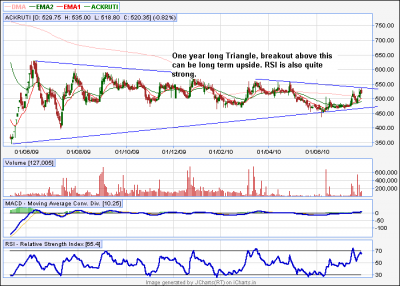
Posting here is One yesar long TRIANGLE pattern of AKUTI, which is very near to be broken.
If taken out, can indicate a long term upside in this counter. It is further validated by increasing strong RSI
Your comments please.
-Sumesh
| Description: |
|
| Filesize: |
29.15 KB |
| Viewed: |
707 Time(s) |
|
|
|
| Back to top |
|
|
karman1990
White Belt
Joined: 21 May 2010
Posts: 19
|
| Post: #21 Posted: Fri Jul 23, 2010 10:10 pm Post subject: |
|
|
| sumesh_sol wrote: | Hi Karman, Chrome
I have not yet closed the trade. can u suggest SL for this (EOD basis).
Regards,
Sumesh
| karman1990 wrote: | | chrome wrote: | | karman1990 wrote: | | sumesh_sol wrote: | Hi Chrome,
I just entered Unitech @86.15. What is your appx. Tgt..?
Regards,
Sumesh
| chrome wrote: | | karman1990 wrote: | | breakout in unitech....weekly TF. |
Hi Karman,
Nice Unitech chart u posted !
UNITECH is also making very beautiful Cup & Handle formation on EOD charts. Also, 86 will be a breakout point for the scrip. Hope, above 86 it will fly |
|
90/92 may possible. |
Hi Sumesh/ Karman..yes 90-95 zone immediate target for Unitech above 86 as per me |
why did'nt you give the bbtc chart earlier....superb breakout... |
|
Hey,Sumesh the stop loss would be 83 on closing basis.
So if it is about to close below 83 exit, else donot panic.
|
|
| Back to top |
|
|
girishhu1
White Belt
Joined: 17 Aug 2009
Posts: 316
|
| Post: #22 Posted: Sat Jul 24, 2010 3:31 pm Post subject: h&s pattern |
|
|
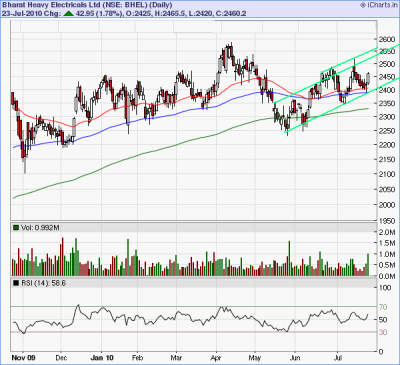
hi chrome/ shekhar/ sumesh,
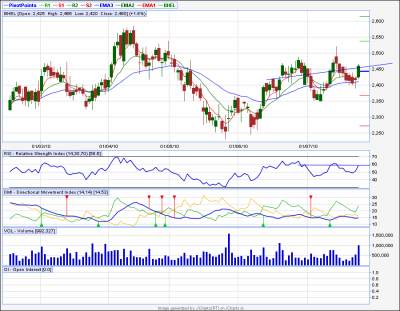
bhel has formed bottom h&s pattern and ready for breakout.your comments pl. note the vol during left and right shoulder formation.
| Description: |
|
| Filesize: |
49.5 KB |
| Viewed: |
736 Time(s) |
|
|
|
| Back to top |
|
|
chrome
Yellow Belt
Joined: 28 Dec 2009
Posts: 645
|
|
| Back to top |
|
|
girishhu1
White Belt
Joined: 17 Aug 2009
Posts: 316
|
| Post: #24 Posted: Sat Jul 24, 2010 9:56 pm Post subject: |
|
|
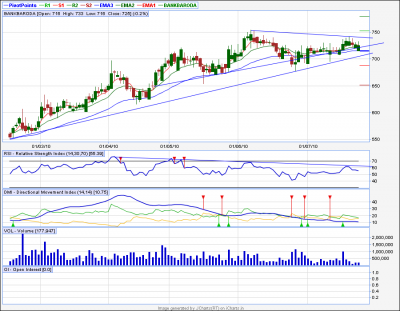
| hns top seen in bob. excuse me for trendline. note the vol at the bottom & top of ralley secreasing with increased price.also the medium term trendline & neckline meet at about the same point- 707.if broken, target can be 660?
|
|
| Back to top |
|
|
girishhu1
White Belt
Joined: 17 Aug 2009
Posts: 316
|
| Post: #25 Posted: Sat Jul 24, 2010 9:58 pm Post subject: |
|
|
chart enclosed.
| Description: |
|
| Filesize: |
49.9 KB |
| Viewed: |
771 Time(s) |
|
|
|
| Back to top |
|
|
girishhu1
White Belt
Joined: 17 Aug 2009
Posts: 316
|
| Post: #26 Posted: Sun Jul 25, 2010 9:48 am Post subject: |
|
|
hello karman,
after fridays bearish candle, do u wish to revise stop loss for unitech?
regards,
girish
|
|
| Back to top |
|
|
karman1990
White Belt
Joined: 21 May 2010
Posts: 19
|
| Post: #27 Posted: Sun Jul 25, 2010 10:21 am Post subject: |
|
|
| girishhu1 wrote: | hello karman,
after fridays bearish candle, do u wish to revise stop loss for unitech?
regards,
girish |
yes i gave the stop loss of 83 after friday......so i stay with it...83 on closing basis.
|
|
| Back to top |
|
|
shekharinvest
Yellow Belt
Joined: 21 Dec 2007
Posts: 549
|
| Post: #28 Posted: Thu Jul 29, 2010 8:00 pm Post subject: |
|
|
| shekharinvest wrote: | Hi,
Just have a look this is an EOD chart.
ANGIND has given a BO also it has formed a C&H formation it may TGT approx 75-80.
SHEKHAR |
ANGIND TGT almost done 77.70
BAJAJ-AUTO on roll
SHEKHAR
|
|
| Back to top |
|
|
sumesh_sol
Brown Belt
Joined: 06 Jun 2010
Posts: 2344
|
| Post: #29 Posted: Thu Jul 29, 2010 8:13 pm Post subject: JAYSHREE TEA |
|
|
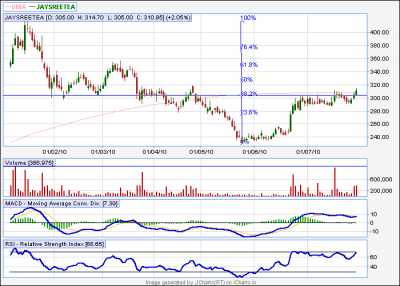
Jayshree Tea seems to be a continuation of successful H&S pattern(see the volume on breaking the H&S upward).
Closed above 200 DMA. RSI running strong above 50
Taget could be 345 & 360
SL below 298.
Regards,
Sumesh
| Description: |
|
| Filesize: |
13.81 KB |
| Viewed: |
757 Time(s) |
|
|
|
| Back to top |
|
|
shekharinvest
Yellow Belt
Joined: 21 Dec 2007
Posts: 549
|
| Post: #30 Posted: Sat Jul 31, 2010 11:18 am Post subject: |
|
|
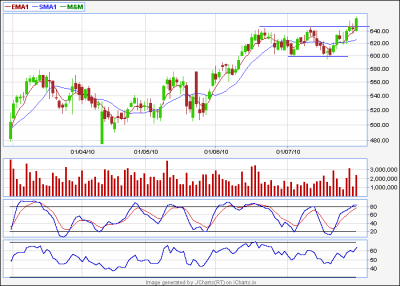
Breakout in M&M.
One can buy now with SL of 636 EOD basis. Short term TGTs can be 690 > 735
It is now at all time highs can go higher if market supports.
SHEKHAR
| Description: |
|
| Filesize: |
13.99 KB |
| Viewed: |
672 Time(s) |
|
|
|
| Back to top |
|
|
|