| View previous topic :: View next topic |
| Author |
C9 Strategy : Can any one explain with help of Charts |
amitkbaid1008
Yellow Belt

Joined: 04 Mar 2009
Posts: 540
|
Post: #1  Posted: Wed Sep 23, 2009 8:09 pm Post subject: C9 Strategy : Can any one explain with help of Charts Posted: Wed Sep 23, 2009 8:09 pm Post subject: C9 Strategy : Can any one explain with help of Charts |
 |
|
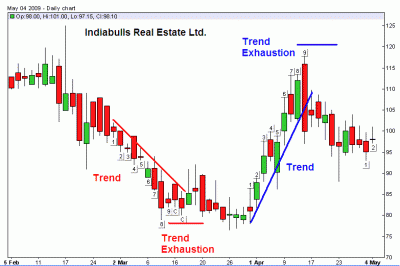
I have read much on C9 Strategy for trend reversal and text which I find I am reproducing below with a Chart. Since I can not understand the set up exactly can any one explain this?
C9 Trading Strategy
A method designed to identify market exhaustion using price patterns. It can help to anticipate trend reversals.
Overview
Based on an indicator called 'Sequential' developed and trade marked by Tom DeMark, this indicator helps identify market exhaustion (based on the premise that price reversals are the result of market exhaustion. The C9 strategy differs in many ways from Mr Demark's indicator. Often, a completed C9 is the best way to identify capitulation or seller exhaustion zone.
Interpretation
C9 Analysis involves a two step process of counting the bars on a bar chart:
Set Up:
Buy set up - count nine consecutive daily price closes which are lower than the close four days earlier.
Sell set up - count nine consecutive daily price closes which are higher than the close four days earlier.
SUMMARY of Correction or Trend Continuation rules
A buy setup is made when prices are declining
High of current buy setup is higher than low of previous sell setup: This setup is a correction, the up move is likely to resume after the buy setup is complete.
High of current buy setup is lower than low of previous sell setup: This setup is a continuation, we will see a counter trend rally, and the down move should resume soon after.
A Sell setup is made when prices are rising.
Low of current sell setup is less than high of previous buy setup. This setup is a correction, the down move is likely to resume after the sell setup is complete.
Low of current sell setup is higher than high of previous buy setup. This setup is a continuation, we will see a counter trend decline, and the up move should resume soon after.
| Description: |
|
| Filesize: |
16.27 KB |
| Viewed: |
762 Time(s) |

|
|
|
| Back to top |
|
 |
|
|  |
amitsaraf21
White Belt

Joined: 20 Feb 2009
Posts: 76
|
Post: #2  Posted: Wed Sep 30, 2009 9:42 pm Post subject: but thats just entry signal Posted: Wed Sep 30, 2009 9:42 pm Post subject: but thats just entry signal |
 |
|
hi
thats just entry signal.
its not complete strategy.
it doesnt talk about profitable exit or stop loss point.
So you must find exit and SL points.
thx
Amit
|
|
| Back to top |
|
 |
amitkbaid1008
Yellow Belt

Joined: 04 Mar 2009
Posts: 540
|
Post: #3  Posted: Wed Sep 30, 2009 9:49 pm Post subject: Posted: Wed Sep 30, 2009 9:49 pm Post subject: |
 |
|
Hi Amit
I think you are misled by use of term BUY SET UP and SELL SET UP. As far as I understand and also what Renowed Technical Analyst Sudarshan Sukhani says it is used for find trend reversal. It is an indicator that trend is reversed and It can also be used for good trading strategy like strategies based on Moving Averages (I think so). However as I am not completely understand this set up or strategy whatever it is I cannot comment much about it.
However thanks for your reply
|
|
| Back to top |
|
 |
|
|
You cannot post new topics in this forum
You cannot reply to topics in this forum
You cannot edit your posts in this forum
You cannot delete your posts in this forum
You cannot vote in polls in this forum
You can attach files in this forum
You can download files in this forum
|
Powered by phpBB © 2001, 2005 phpBB Group
|
|

