|
|
| View previous topic :: View next topic |
| Author |
Calls Insights &Amp; Views On Commodity Short Term Trading |
pradeepgolfer
White Belt

Joined: 16 Sep 2009
Posts: 212
|
Post: #16  Posted: Sun Aug 15, 2010 9:05 am Post subject: Posted: Sun Aug 15, 2010 9:05 am Post subject: |
 |
|
dviveerbabu
Thank you for the confidence you have shown in me, as you have asked your question to me-sorry for the delay in answering it.
The ma not giving a sell signal on daily charts but giving a sell on shorter time frames, means that lead, in the short term-2-4 days will be down.
But, on the daily, the ma not crossing over means that no sell is given on the daily and on the daily the uptrend will resume after consolidation and so it is a buying opportunity for a positional trade.This is further confirmed by the evidence of a large bullish, up candle, with a long tail,was formed, when lead went below the 21 ma on thursday.
A positional long trade can be entered into with a stop below the low of thursday,94.7, with targets of 105,108 approx.
As a general guide, Usage of weekly or daily charts for trend determination and 60 min for entry is good for positional trading.In intraday trading, the useful timeframes are perhaps 15min or 20 min, being used to gauge trend, while the 5 min can be used for entry and stops.
Hope this helps-any further questions may be asked,I wilL be happy to clarify.
|
|
| Back to top |
|
 |
|
| |
pradeepgolfer
White Belt
Joined: 16 Sep 2009
Posts: 212
|
| Post: #17 Posted: Tue Aug 17, 2010 9:20 am Post subject: |
|
|
Today appears to be a day of introspection and trading,if any, should be done with small positions.It is not necessary to trade every day and overtrading will not keep you in a frame of mind, to take advantage of big moves, when they happen.
COPPER
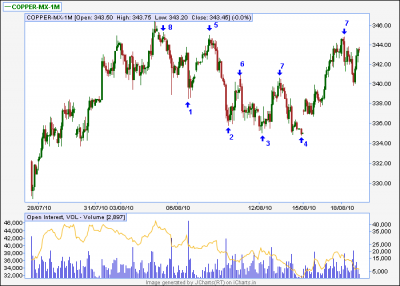
The daily pivot low of 333.70 and the pivot high of 340.8 is likely to frame the trading area of copper.
Copper bounced off the 20 day moving average and the pivot high of 334.8, whicn was also Friday's low.The fall from 346 has a consolidation type of momentum and considering the strong rally that took place before and since this rally cannot be considered a bear pull back, as it was entirely above the 20 DMA.A trend cannot change easily,and so at least, a test of 346 is likely and a change in trend can only be expected after a lower high is formed.
On the intraday charts copper has been swinging both ways indicating both sides-bull bear- are active.Yesterday was a relatively low volatility day and this is a hint that the consolidation is ready, for a test of the previous high.
Because a test of the high 346,is likely and volatility has gone down,avoid initiating short positions.Positional trades can be continued to be held with a stop of 333.7.
ZINC
should be bought only above 97.3 and this can be as stop for a short position.Converging trendlines may be drawn and that is not a bullish indication. Avoid long positions.Target for short is 94.5
LEAD
Lead has traded between 96.10 and 97.10 for two trading sessions.Better observe.Positional trades can be held with the stop given earlier of below 94.7.
|
|
| Back to top |
|
|
pradeepgolfer
White Belt
Joined: 16 Sep 2009
Posts: 212
|
| Post: #18 Posted: Wed Aug 18, 2010 9:23 am Post subject: |
|
|
The big move in base metals yesterday shows that bull interest is back but the all round optimism will be used to lay a bull trap.
I expect the resolve and strength of the bulls will be tested with a test bear charge and that test will have to be watched.
It might be better to avoid longs till a good entry and set up is provided.
|
|
| Back to top |
|
|
pradeepgolfer
White Belt
Joined: 16 Sep 2009
Posts: 212
|
| Post: #19 Posted: Thu Aug 19, 2010 8:02 am Post subject: |
|
|
COPPER
Sell the early rally or breakout and do not go long.If there is no early rally till 11.30 am , sell. Stops above 334.95 or above 345.30.
EXPLANATION
I have given my reasoning, which is my own brand of technical analysis, and may be interesting for all traders to read.
My method is very simple to apply.All simple things are very complicated to explain.But once understood, does not take long to reason out, when any chart, in any market, is opened or analysed.Since this method is not patented, you can use it free. However, it is not a fixed system, which can be used without thinking. My method demands thinking.
It is very powerful and can be applied to any market where there are bears and bulls.
Copper is in a uptrend on the daily time frame, of that, there is no doubt. And conventional technical analysis stresses a lot on the past; however it does not help the trader, if the money made in the past, is lost in the present.
There are some very interesting points to be noted and that is why I have included a detailed explanation for this call. Most traders are students of technical analysis and it should be enlightening.
The lower low made by bar 1, was made on extremely high volume and bar 5 was a lower high at 345.95.The bar 4 was a lower low. Bars 2, 3, 4, made a wedge and the target for a wedge is the height of the wedge,projected from the top of the wedge.That was achieved by bar 7,which was also a lower high.There is therefore two lower highs and two lower lows- 8 & 1,5 & 4-and bar 7 made one lower high.
The high of bar 5 has to be taken out if this short term downtrend is to be ended.If high of bar 5 is not taken out, then it is reasonable to assume, that bar 4 will be tested. Since a downtrend has been established, the probability for the low of bar 4 to be taken out, is high.Another possibility is the formation of a higher low, above bar 4.Since, it is highly unlikely that copper would fall 10 points in a single session,that would happen today ,if bar 5 is not taken out by a significant amount.So breakouts can be sold and position reversed if stopped out.
THe fall from bar 5 to bar 2 was very sharp. The rise from bar 4 to bar 7 may, therefore, be a test* of the sharp fall, from bar 5 to bar 2. However,this move from bar 4 to bar 7 was also a sharp move and also, it is very important to note that this move from bar 4 to bar 7, is the first significant bull move in August.The bulls are unlikely to increase their commitments, without waiting to see the response of the bears. So, if the bears do not, or cannot, attack with force today, that will be clearly indicated by a small trading day range day. A trading range day today means a long position can be taken tomorrow and the rally will likely be sharp.
There is another sinister possibility: that this rally was initiated by the bears and is a bull trap. This trap, if it is one, should be sprung today, by a small rise after open, only to reverse.This will trap intraday bulls as well.So do not go long at the open.
*
I should point out to novices, that sharp falls and rises will be 'tested',which is fancy way of saying a counter move should be expected, initiated by the opposite camp, to see if that sharp move is justifiable and will be protected by the camp. who initiated it in the first place.
| Description: |
|
| Filesize: |
16.26 KB |
| Viewed: |
560 Time(s) |
|
|
|
| Back to top |
|
|
pradeepgolfer
White Belt
Joined: 16 Sep 2009
Posts: 212
|
| Post: #20 Posted: Thu Aug 19, 2010 12:20 pm Post subject: |
|
|
go long copper stop below 342
reverse if short immediately
|
|
| Back to top |
|
|
pradeepgolfer
White Belt
Joined: 16 Sep 2009
Posts: 212
|
| Post: #21 Posted: Fri Aug 20, 2010 7:25 am Post subject: |
|
|
Copper gold and Zinc are outperforming while nickel silver and lead are likely to seek lower levels
COPPER
A pull back to above 343 can be sold with a stop of above 344.6, 345.10 is suggested.Target of 337
This is the ideal trade and it is advisable to wait for this even though the operator is unlikely to be so generous to provide such an opportunity.After the drama yesterday do not trade emotionally.
ZINC
Buy with stop 96.65 target 98.5
LEAD
Sell lead in the range of 98-98.4 stop 99 target 96. Buy in the range 96-95.5 stop 94.9
SILVER
Sell with stop 29600
GOLD
Buy with stop of 18663 for a positional trade
|
|
| Back to top |
|
|
karjey
White Belt
Joined: 09 Aug 2010
Posts: 3
|
| Post: #22 Posted: Sat Aug 21, 2010 11:50 am Post subject: commodities in sight |
|
|
Sir,
Daily ur messages in this thread is very useful for me( i m new trader)
Before trading i read ur messages carefuly and i made some profits last week. hats up. thank u 
|
|
| Back to top |
|
|
pradeepgolfer
White Belt
Joined: 16 Sep 2009
Posts: 212
|
| Post: #23 Posted: Sat Aug 21, 2010 4:18 pm Post subject: |
|
|
It is good you made money-that is your position management and credit goes to you.
Try to read what I post so that you can in time analyse the charts yourself.
You should develop your own knowledge and trading style.
Good luck
|
|
| Back to top |
|
|
pradeepgolfer
White Belt
Joined: 16 Sep 2009
Posts: 212
|
| Post: #24 Posted: Sun Aug 22, 2010 12:21 pm Post subject: |
|
|
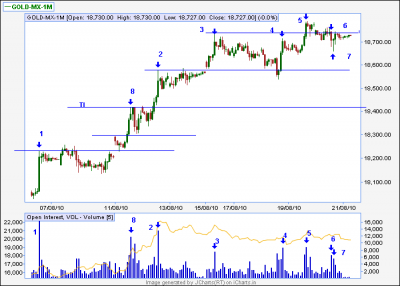
GOLD
CALL
Sell between 18820 - 18850 STOP ABOVE 18890 with targets 18491,18417.
This is a countertrend call and the bulls, as of now are still in good health, so only take a small risk.
EXPLANATION
Since this is sunday,my wife is going to visit her sick realtive and I am not drnking beer, I have time to explain these points, as a practical technical analysis lesson.
All the observations below will not take five minutes for me but it has taken me hours to explain, so I hope you all will read the below, as a lesson in technial analysis.
There are a lot of interesting points about the gold chart.
Bar 1 was a large bull bar, which closed almost at it's high.The corresponding volume marked 1, was also very large.Whenever there is very large volume, associated with a bar of any time frame, that bar will be tested:if the bar is a bull bar, the price will attempt to go below the bar's low-if it cannot go below the low, this shows the bulls are strong enough and willing to support their position; if the bar is a bear bar, then the price will attempt to break the high of that bear bar, to test whether the bears are strong enough and willing to protect their position.This is called a test
The test of bar one did not go anywhere near the low of the bar but took the shape of a tight range that lasted more tha 20 hours.That was an indication of the strength of the bulls or the unwillingness of the bears to be aggresive sellers:both, very bullish indications.
The opening gapped above the high of bar 1, confirming a successful test and the consequent pullback to the high of bar 1, was a breakout pullback and a buying opportunity. The breakout of that days high took gold to bar 8, which was a high volume bull bar, closing near the middle.The next bar could not take out the high of bar 8 and so the bears attacked and a big bear bar, that engulfed two bull bars, was the result.The next bear bar was a small body bear bar-almost a doji-showing that the bears could not maintain control and the green bar following the small bear bar, confirmed the bulls control and the breakout pullback.
The breakout above bar 8 took gold to bar 2 and the tight trading range at a major resistance level of 18550 and no rejection of that level,which was mentioned in the buy call given in my post dated 9 August ,showed gold may break that resistance.And break it did and with a gap and gold went up to bar 3-the volume, marked 3, was interestingly low, showing lack of partcipation, perhaps, and that resulted in a very long consolidation which ended when the gap was filled and the breakout of bar 2 was tested.The rally that resumed after the gap was filled,was accompanied by much better volume, showing participation was much better and that buyers were waiting at lower levels, while the bears were wiling to provide the supply.
Gold then went up to bar 4.The volume marked 4 was high and the range of bar 4 was much less, than the preceding bull bar, which had less volume.The smaller range but higher volume meant the bears were aggresively selling into bar 4.But the bears could not break the bar 4 low and gold went to bar 5.Bar 6 was a bear bar which broke the low of bar 5 and fell to bar 7 but the bulls came right back and took out the high of bar 6 by one rupee,thereby showing off their strength.
The breakout pullback from bar 3, went below the high of bar 2, by a small amount and the breakout pullback from bar 5, went below the high of bar 4, by a bigger amount,showing the bears were gaining,if only by a small amount.
From all these observations, a trading strategy has to be made, since we want to make money and not win a Nobel prize.
I have observed a lot of breakouts and breakout tests or pullbacks.But the breakout above bar 8 has not been tested and there is no breakout pull back.This is marked by the trendline marked TL;I expect the market will come down to this level to test it.
COPPER
buy between 338.2 - 337 STOP 336.7 target 343.5 - 344
ZINC
BUY BETWEEN 95.55 AND 95.05 STOP 94.90. Target 96.5 - 98
CRUDE
Better to avoid.But if you must trade in crude do not sell until 3444 is broken and do not buy until 3570 is taken out.
NICKEL
will only be uptrend only if it trades above 1030 for some time.And downtrend if it breaks 994.Niclel can be bought with a stop of 1002,999 for a target range of 1024-1030
| Description: |
|
| Filesize: |
13.18 KB |
| Viewed: |
554 Time(s) |
|
Last edited by pradeepgolfer on Sun Aug 22, 2010 7:21 pm; edited 1 time in total |
|
| Back to top |
|
|
kps
White Belt
Joined: 19 Feb 2010
Posts: 6
|
| Post: #25 Posted: Sun Aug 22, 2010 4:42 pm Post subject: |
|
|
Good work Pradeep,
Please Keep it up,
Regards,
kp
|
|
| Back to top |
|
|
pradeepgolfer
White Belt
Joined: 16 Sep 2009
Posts: 212
|
| Post: #26 Posted: Sun Aug 22, 2010 5:50 pm Post subject: |
|
|
kps
Thanks for reading and for the encouragement.
|
|
| Back to top |
|
|
pradeepgolfer
White Belt
Joined: 16 Sep 2009
Posts: 212
|
| Post: #27 Posted: Tue Aug 24, 2010 7:54 am Post subject: |
|
|
BACKGROUND UPDATE
Yesterday's price movement in copper could be described in traditional terms as an inside day,a day of consolidation.Some consolidations are quiet affairs, this consolidation was filled with noise,whipsaws, volatile moves, within a smaller than average range.Whipsaws is a polite word, for something both bulls and bears, find very distasteful,known as stop running.The stop losses of both the sworn enemies, were triggered at least once;tight stops would have been triggered numerous times.This nonchalent display of nastiness, is displayed sometimes by the market,in order to to remind both the bulls and bears, of one simple reality: that, in this financial galaxy, the market is Emperor,undisputed ruler,and any ignorance or non acceptance of His Highness,will be punishable, by frustration.
This violent whipsawing consolidation, would effectively discourage weak bulls and weak bears from taking positions today,as it is supposed to do.But because the last stronghold of the bulls,336.70, was not taken by the bears,it appears the bulls have won.The fact that the bears were not challenged at the border of bull's territory but were allowed to pierce deep, into enemy territory, before a counter attack was initiated ,was in fact a brillant move and a trap for the bears.
Lead however remains in bear hands and will be an underperformer if the bulls reign supreme as expected.Nickel is neutral but will be bullish above 994.Silver is ready for a big move.Crude may bounce.The buy call given intraday for gold is reconfirmed and a positional trade is recommended.
CALLS
Targets are suggestions and not always achieved;remember to watch for signs of weakness of trend and exit position. This is advice for intraday players-positional players can wait for my daily update.
COPPER
A positional buy should be initiated with suggested stops of 336.65,335.Intraday target of 343.5 to 344.60 can be expected.
CRUDE
BUY WITH STOP OF 3426.Target 3591.
Though bearish there is some bull interest starting.This may just be a bull test to check the reaction of the bears.
A pattern,where converging trendlines can be drawn,has formed and there was a downward breakout on good volume.I doubt this breakout and I expect there might be breakout failure and a bear trap because this pattern has formed after a very long downmove;such patterns sometimes signal the end of a downmove.
If there is no down gap opening then crude can be bought with a stop of 3426.Shorting should be avoided since crude is at around at least a months low.
GOLD
BUY GOLD STOP BELOW 18646. target ABOVE 19000
SILVER
BUY SILVER WITH STOP OF 28755 28726 FOR A TARGET OF 32000.
Once silver crosses 29194,the bulls wil take over.
ZINC
Buy zinc with a stop of below 94.25. Above 95.25 bulls will take charge.Resistances are 96.3 and the range of 97.5 to 98.25 is a strong one.But that is the same range where the bulls should try to take over so expect some volatility and watch keenly to see who is winning the battle.
|
|
| Back to top |
|
|
trendy
White Belt
Joined: 16 Oct 2006
Posts: 40
|
| Post: #28 Posted: Tue Aug 24, 2010 1:19 pm Post subject: |
|
|
Hi Pradeep,
Your unconventional technical analysis is simple and your explanation elaborate!!
You definitely deserve huge appreciation.
All the best and Thanks!
|
|
| Back to top |
|
|
pradeepgolfer
White Belt
Joined: 16 Sep 2009
Posts: 212
|
| Post: #29 Posted: Tue Aug 24, 2010 2:41 pm Post subject: |
|
|
| You did not mention whether you made money or not- that is the true test!
|
|
| Back to top |
|
|
pradeepgolfer
White Belt
Joined: 16 Sep 2009
Posts: 212
|
| Post: #30 Posted: Wed Aug 25, 2010 9:47 am Post subject: |
|
|
COPPER
BUY AROUND 331-331.6 STOP LOSS 330.10,228 FOR A MINIMUM TARGET OF 344
One key point is that unless 330.65 is broken conclusively on the downside, 344.6 is the minimum target. Also it should be noted that copper went from a low of 330.7 to a high of 346.7 in 5 days and then spent the next 17 days retracing less than that rise-this cannot be concluded to be anything other than consolidation.There is no rejection of the higher level-only some profit booking.The broad trading range rather than a swift fall shows that the price of copper is acceptable to both bears and bulls considering the fundamentals of copper.
A fall towards 331 may come because of bearish sentiment and a positional trade can be initiated because of the above reasons.The stop loss is close and that is an advantage but NOT the reason for the trade
Copper has bull interest between 334.3 to 328 and bulls should protect 331.55.The low of yesterday is 332.55 and because sentiment is so bearish that low may reasonably be expected to be broken and that would be the best time for the bulls to attack,when the bears are at their highest confidence level.However,there is no guarantee who will win the battle and do not get caught in the crossfire.
Copper traded for 5 hours in the range 334.6 to 322.55.In that five hours there were 2 bear bars,one bull bar and three dojis.The high of the bull bar broke out above the trading range only to have the bears, not only counterattack, but also take out the low of the bull bar,to show who is boss.
Any upside breakout from this 5 hour range will be sold into by the bears and it is advisable to do the same.The taget will be below yesterday's day low
|
|
| Back to top |
|
|
|
|
You cannot post new topics in this forum
You cannot reply to topics in this forum
You cannot edit your posts in this forum
You cannot delete your posts in this forum
You cannot vote in polls in this forum
You can attach files in this forum
You can download files in this forum
|
Powered by phpBB © 2001, 2005 phpBB Group
|
|
|


