| View previous topic :: View next topic |
| Author |
CANDLES AND CANDLE'S ONLY |
rajmohanmbamhr
White Belt

Joined: 13 Oct 2011
Posts: 444
|
Post: #1  Posted: Tue Feb 07, 2012 7:49 pm Post subject: CANDLES AND CANDLE'S ONLY Posted: Tue Feb 07, 2012 7:49 pm Post subject: CANDLES AND CANDLE'S ONLY |
 |
|
Potential candle stick reversals Daily/weekly/monthly...The daily candle stick patterns can be used for next day Day trading and the Weekly patterns can be used for taking Positional trades
Last edited by rajmohanmbamhr on Tue Feb 07, 2012 7:57 pm; edited 2 times in total |
|
| Back to top |
|
 |
|
|
|
rajmohanmbamhr
White Belt
Joined: 13 Oct 2011
Posts: 444
|
| Post: #2 Posted: Tue Feb 07, 2012 7:51 pm Post subject: Rel capital |
|
|
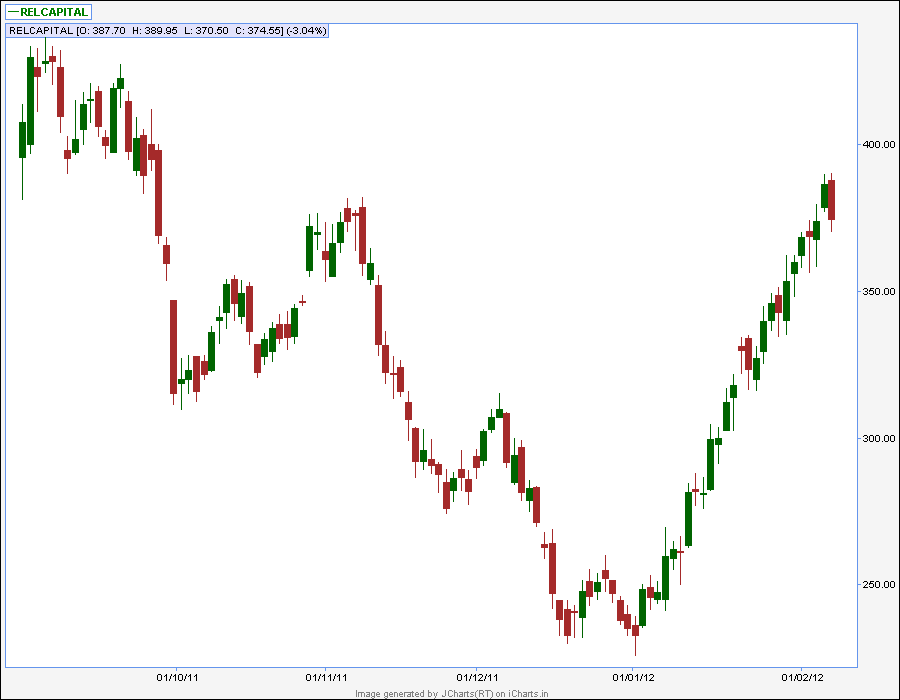
Bearish Engulfing Daily chart SELL BELOW 370
| Description: |
|
| Filesize: |
8.38 KB |
| Viewed: |
1909 Time(s) |
|
|
|
| Back to top |
|
|
rajmohanmbamhr
White Belt
Joined: 13 Oct 2011
Posts: 444
|
| Post: #3 Posted: Tue Feb 07, 2012 7:53 pm Post subject: Opto circuits |
|
|
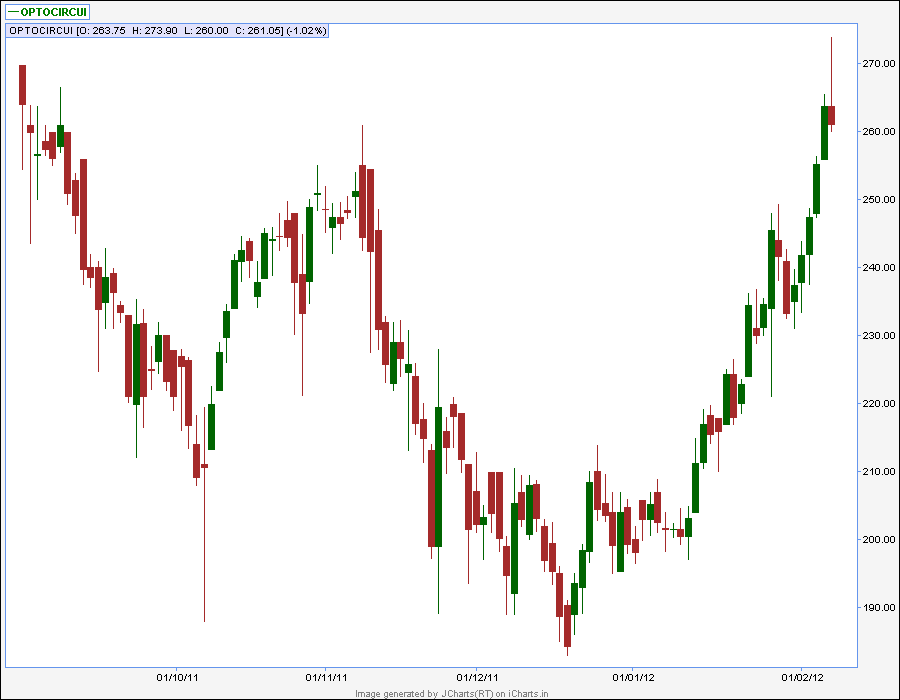
Sell Below 260
Bear trap was done Need some filters
| Description: |
|
| Filesize: |
9.55 KB |
| Viewed: |
1960 Time(s) |
|
Last edited by rajmohanmbamhr on Wed Feb 08, 2012 5:55 pm; edited 1 time in total |
|
| Back to top |
|
|
rajmohanmbamhr
White Belt
Joined: 13 Oct 2011
Posts: 444
|
| Post: #4 Posted: Tue Feb 07, 2012 8:16 pm Post subject: Nifty |
|
|
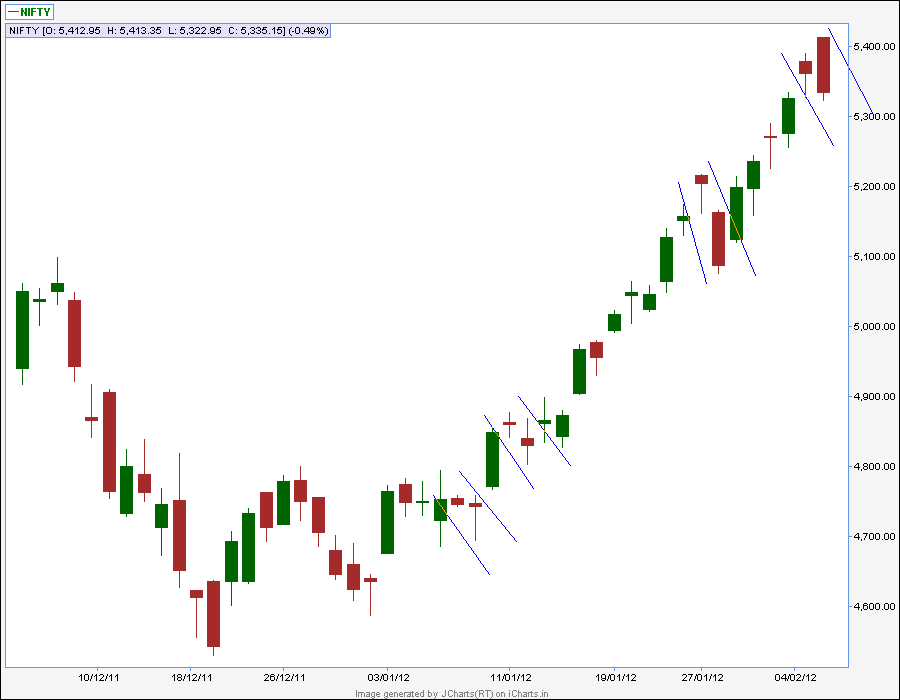
Rising Three Methods: A bullish continuation pattern in which a long white body is followed by three small body days, each fully contained within the range of the high and low of the first day. The fifth day closes at a new high.
But in Indian market (not only in the below chart)most of the times the fourth day candle was missing..Lets see whats going to happen tommorow..
But taking Long is only recommended above today's high (07/02) ...
| Description: |
|
| Filesize: |
8.99 KB |
| Viewed: |
1937 Time(s) |
|
|
|
| Back to top |
|
|
KatrinaaDP
White Belt
Joined: 11 Sep 2010
Posts: 95
|
| Post: #5 Posted: Tue Feb 07, 2012 10:26 pm Post subject: |
|
|
| good rajmohan sir
|
|
| Back to top |
|
|
ESNMURTY
White Belt
Joined: 31 Oct 2009
Posts: 380
|
| Post: #6 Posted: Tue Feb 07, 2012 10:31 pm Post subject: candles |
|
|
| Hi, I wish have a clarification.In the charts presented by you, It is expected that the price would fall.Kindly clarify , if it would fall on the very next day or will it take some days to fall.
|
|
| Back to top |
|
|
jyothi2011
White Belt
Joined: 10 Oct 2011
Posts: 81
|
| Post: #7 Posted: Tue Feb 07, 2012 10:40 pm Post subject: |
|
|
| good job!
|
|
| Back to top |
|
|
rajmohanmbamhr
White Belt
Joined: 13 Oct 2011
Posts: 444
|
| Post: #8 Posted: Wed Feb 08, 2012 6:06 am Post subject: Re: candles |
|
|
| ESNMURTY wrote: | | Hi, I wish have a clarification.In the charts presented by you, It is expected that the price would fall.Kindly clarify , if it would fall on the very next day or will it take some days to fall. |
As long as the stop loss is not triggered the selling is valuable In simple words sell only below the bearish candle and keep that candles high as stop loss..And vice versa
Note: If slop loss is triggered before selling triggered then selling becomes invalid
Regards
Raj
|
|
| Back to top |
|
|
rajmohanmbamhr
White Belt
Joined: 13 Oct 2011
Posts: 444
|
| Post: #9 Posted: Wed Feb 08, 2012 6:10 am Post subject: Re: candles |
|
|
| rajmohanmbamhr wrote: | | ESNMURTY wrote: | | Hi, I wish have a clarification.In the charts presented by you, It is expected that the price would fall.Kindly clarify , if it would fall on the very next day or will it take some days to fall. |
As long as the stop loss is not triggered the selling is valuable In simple words sell only below the bearish candle and keep that candles high as stop loss..And vice versa
And There is no time frame when it will fall but once the market falls these stocks will lead
Note: If slop loss is triggered before selling triggered then selling becomes invalid
Regards
Raj |
|
|
| Back to top |
|
|
sherbaaz
Yellow Belt

Joined: 27 May 2009
Posts: 543
|
| Post: #10 Posted: Wed Feb 08, 2012 8:44 am Post subject: |
|
|
Hi rajmohanmbamhr,
Since how long have you been using candle sticks the way you have presented. do you have record of profitable trades you have made using candle sticks (reversal) signals.
As for good reasons I know this naked/stand alone candlesticks will not work in long run. Taking reversal signals in the strong trend. You may have couple of profitable trades here and there but in the long run they will dry up.
its a fantastic way of representation of price on chart but as per me it does not work this way.
regds,
|
|
| Back to top |
|
|
rajmohanmbamhr
White Belt
Joined: 13 Oct 2011
Posts: 444
|
| Post: #11 Posted: Wed Feb 08, 2012 5:56 pm Post subject: Re: Nifty |
|
|
| rajmohanmbamhr wrote: | Rising Three Methods: A bullish continuation pattern in which a long white body is followed by three small body days, each fully contained within the range of the high and low of the first day. The fifth day closes at a new high.
But in Indian market (not only in the below chart)most of the times the fourth day candle was missing..Lets see whats going to happen tommorow..
But taking Long is only recommended above today's high (07/02) ... |
High was not broken..
|
|
| Back to top |
|
|
ESNMURTY
White Belt
Joined: 31 Oct 2009
Posts: 380
|
| Post: #12 Posted: Wed Feb 08, 2012 11:34 pm Post subject: Re: candles |
|
|
| rajmohanmbamhr wrote: | | rajmohanmbamhr wrote: | | ESNMURTY wrote: | | Hi, I wish have a clarification.In the charts presented by you, It is expected that the price would fall.Kindly clarify , if it would fall on the very next day or will it take some days to fall. |
As long as the stop loss is not triggered the selling is valuable In simple words sell only below the bearish candle and keep that candles high as stop loss..And vice versa
And There is no time frame when it will fall but once the market falls these stocks will lead
Note: If slop loss is triggered before selling triggered then selling becomes invalid
Regards
Thanks and regards
Raj |
|
Thanks and regards
|
|
| Back to top |
|
|
rajmohanmbamhr
White Belt
Joined: 13 Oct 2011
Posts: 444
|
| Post: #13 Posted: Sat May 04, 2013 3:34 pm Post subject: BankNifty |
|
|
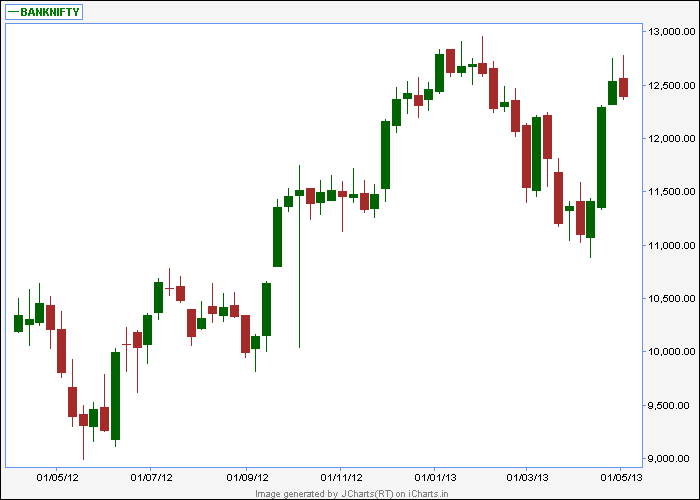
BankNifty Reversal Pattern in Weekly Chart
| Description: |
|
| Filesize: |
5.67 KB |
| Viewed: |
1540 Time(s) |
|
|
|
| Back to top |
|
|
rajmohanmbamhr
White Belt
Joined: 13 Oct 2011
Posts: 444
|
| Post: #14 Posted: Sat May 04, 2013 3:40 pm Post subject: Infy Bullish Engulfing |
|
|
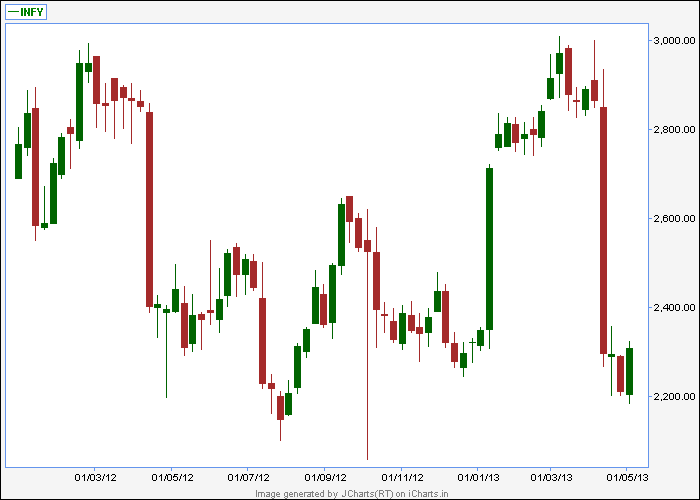
Infy Bullish Engulfing
| Description: |
|
| Filesize: |
6.18 KB |
| Viewed: |
1535 Time(s) |
|
|
|
| Back to top |
|
|
rajmohanmbamhr
White Belt
Joined: 13 Oct 2011
Posts: 444
|
| Post: #15 Posted: Sat May 04, 2013 3:44 pm Post subject: Here The Strong BUY strictly Only Above 322(Weekly) |
|
|
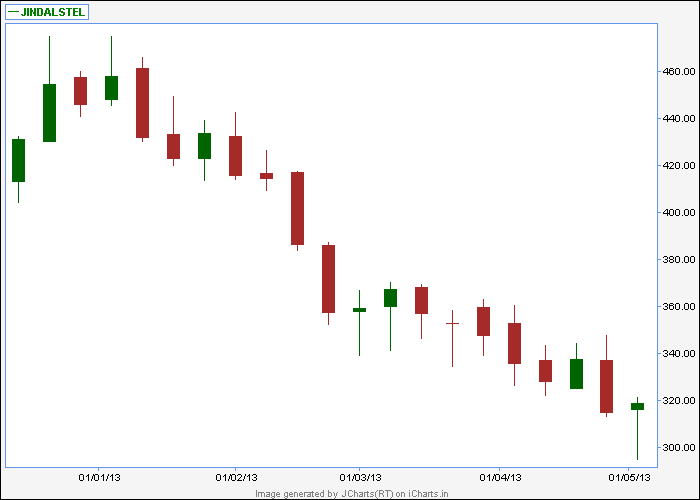
Here The Strong BUY strictly Only Above 322(Weekly)
| Description: |
|
| Filesize: |
4.5 KB |
| Viewed: |
1532 Time(s) |
|
|
|
| Back to top |
|
|
|


