| View previous topic :: View next topic |
| Do you think this thread would add value? |
| Yes |
|
93% |
[ 86 ] |
| No |
|
6% |
[ 6 ] |
|
| Total Votes : 92 |
|
| Author |
Candlestick Patterns... |
singh.ravee
Yellow Belt

Joined: 12 Aug 2010
Posts: 678
|
Post: #106  Posted: Thu Mar 03, 2011 10:28 am Post subject: Posted: Thu Mar 03, 2011 10:28 am Post subject: |
 |
|
Hello Everybody,
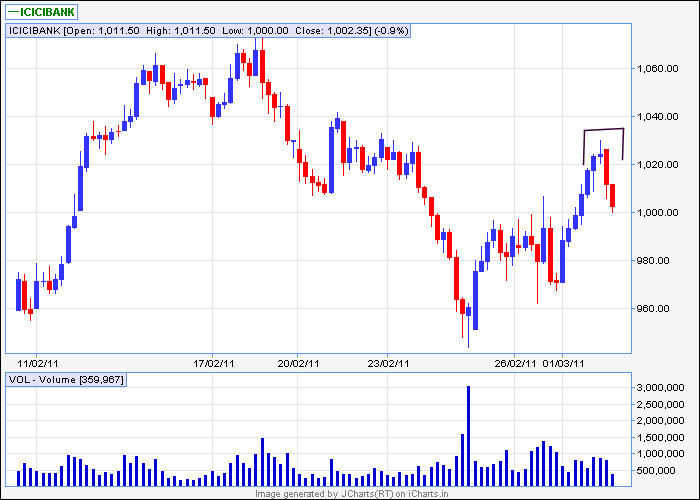
An evening star in icicibank 60min
thanks and regards
ravee
| Description: |
|
| Filesize: |
9.83 KB |
| Viewed: |
2164 Time(s) |
|
|
|
| Back to top |
|
 |
|
|
 |
singh.ravee
Yellow Belt

Joined: 12 Aug 2010
Posts: 678
|
Post: #107  Posted: Thu Mar 03, 2011 10:41 am Post subject: Posted: Thu Mar 03, 2011 10:41 am Post subject: |
 |
|
Hello everybody,
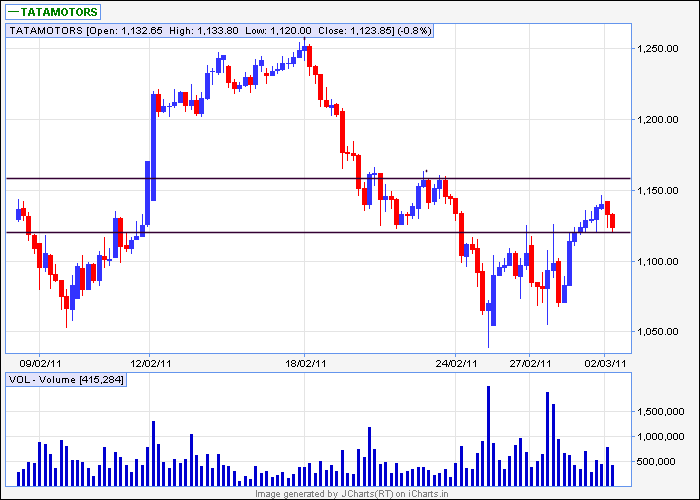
is it reversal encountered in tata motors 60min?
as per my understanding, any good downmove will begin below 1120.
thanks and regards
ravee
| Description: |
|
| Filesize: |
9.36 KB |
| Viewed: |
2167 Time(s) |
|
|
|
| Back to top |
|
 |
singh.ravee
Yellow Belt

Joined: 12 Aug 2010
Posts: 678
|
Post: #108  Posted: Thu Mar 03, 2011 12:00 pm Post subject: Posted: Thu Mar 03, 2011 12:00 pm Post subject: |
 |
|
[quote="singh.ravee"]Hello Everybody,
An evening star in icicibank 60min
thanks and regards
ravee
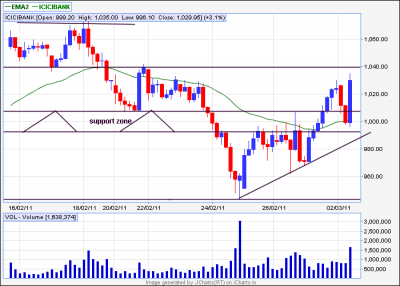
I wish to highlight one fact of this evening star of icicibank 60min. Every candlestick reversal signal is not tradeable. Thats the reason, I didnt shared any entry, sl or exit points in previous chart. Kindly relook at the same chart. Observe support zone, rising trend line and 35 ema providing support.
thanks and regards
ravee
| Description: |
|
| Filesize: |
15.67 KB |
| Viewed: |
475 Time(s) |
|
|
|
| Back to top |
|
 |
singh.ravee
Yellow Belt

Joined: 12 Aug 2010
Posts: 678
|
Post: #109  Posted: Thu Mar 03, 2011 2:00 pm Post subject: Posted: Thu Mar 03, 2011 2:00 pm Post subject: |
 |
|
Sherbaaz hello,
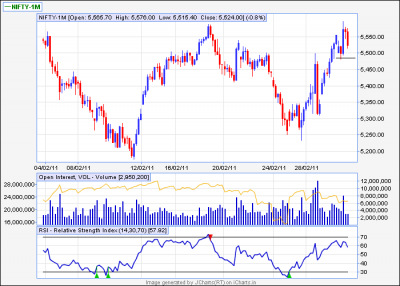
An evening star variation in nifty 60min around resistance. In this case can we use close below immediate previous low 5485 as confirmation of trend reversal. Or any other method is to be used.
Kindly share your valuable observation.
thanks and regards
ravee
| Description: |
|
| Filesize: |
32.46 KB |
| Viewed: |
496 Time(s) |
|
|
|
| Back to top |
|
 |
sherbaaz
Yellow Belt

Joined: 27 May 2009
Posts: 543
|
Post: #110  Posted: Thu Mar 03, 2011 4:11 pm Post subject: Posted: Thu Mar 03, 2011 4:11 pm Post subject: |
 |
|
| singh.ravee wrote: | Sherbaaz hello,
An evening star variation in nifty 60min around resistance. In this case can we use close below immediate previous low 5485 as confirmation of trend reversal. Or any other method is to be used.
Kindly share your valuable observation.
thanks and regards
ravee |
hi,
this is a very weak evening star pattern. i will not trade or look for trend reversal using it. you have rightly pointed nf is at strong resistance 5570-5600 is strong resistance zone.
if you draw a upward sloping trend line also its very steep.
a close below the line you have drawn can be taken as trend change. but i will not trade that also. for me on this chart first a bearish trend has to be established. I will prefer to trade in the trend rather than taking SHORT position at the trend reversal zone (if any).
regds,
|
|
| Back to top |
|
 |
singh.ravee
Yellow Belt

Joined: 12 Aug 2010
Posts: 678
|
Post: #111  Posted: Thu Mar 03, 2011 6:42 pm Post subject: Posted: Thu Mar 03, 2011 6:42 pm Post subject: |
 |
|
Sherbaaz bhai,
Thank you so much for your reply.
I didnt trade this evening star either.
Regards
ravee
|
|
| Back to top |
|
 |
S.S.
White Belt

Joined: 09 Feb 2011
Posts: 241
|
Post: #112  Posted: Fri Mar 04, 2011 11:46 pm Post subject: Posted: Fri Mar 04, 2011 11:46 pm Post subject: |
 |
|
hello every one.....
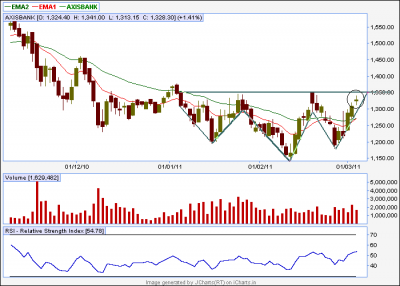
inverted h&d in axis bank EOD chart with a shooting star and 13ema might cross 34ema prob. on monday
| Description: |
|
| Filesize: |
21.08 KB |
| Viewed: |
488 Time(s) |
|
|
|
| Back to top |
|
 |
singh.ravee
Yellow Belt

Joined: 12 Aug 2010
Posts: 678
|
Post: #113  Posted: Sat Mar 05, 2011 9:15 am Post subject: Posted: Sat Mar 05, 2011 9:15 am Post subject: |
 |
|
| S.S. wrote: | hello every one.....
inverted h&d in axis bank EOD chart with a shooting star and 13ema might cross 34ema prob. on monday |
S.S.
Nice attempt by you. Kindly analyse the volume aspect of inverted h&s. According to my limited knowledge the volume with right shoulder should be least. However, volume is increasing in this case.
Its not a shooting star. A shooting star should have no lower shadow or very small lower shadow. However its a star(doji). Since its coming at previous resistance of 1350 which is also 200sma, it hold more value.
However good part about the stock is that its able to make a higher bottom.
Thanks and Regards
Ravee
|
|
| Back to top |
|
 |
girishhu1
White Belt

Joined: 17 Aug 2009
Posts: 316
|
Post: #114  Posted: Sat Mar 05, 2011 9:53 am Post subject: Posted: Sat Mar 05, 2011 9:53 am Post subject: |
 |
|
ravee/ sherbaz,
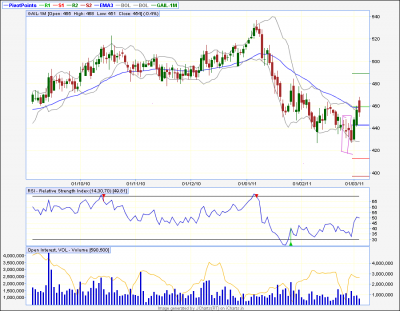
enclosing tristar formation as seen by me in gail (brought to your notice earlier). can anyone familiar with this pattern confirm this pattern?
regards,
girish
| Description: |
|
| Filesize: |
44.04 KB |
| Viewed: |
472 Time(s) |
|
|
|
| Back to top |
|
 |
singh.ravee
Yellow Belt

Joined: 12 Aug 2010
Posts: 678
|
Post: #115  Posted: Sat Mar 05, 2011 10:08 am Post subject: Posted: Sat Mar 05, 2011 10:08 am Post subject: |
 |
|
Girish hello,
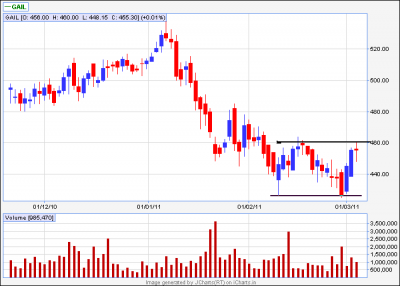
interestingly there is difference in gail eod chart posted by u and the one that i find on icharts.
If I come to your chart the tristar as bottom reversal (as pointed by you) is already discounted.
Kindly consider following;
1. stock in lateral zone = 425- 460
2. Doji in uptrend
3. Upper end of lateral zone and 35 ema coincides.
4. Price congestion in 60min chart at upper level.
Thanks and Regards
Ravee
| Description: |
|
| Filesize: |
19.29 KB |
| Viewed: |
497 Time(s) |
|
|
|
| Back to top |
|
 |
amitkbaid1008
Yellow Belt

Joined: 04 Mar 2009
Posts: 540
|
Post: #116  Posted: Sat Mar 05, 2011 3:37 pm Post subject: Posted: Sat Mar 05, 2011 3:37 pm Post subject: |
 |
|
| singh.ravee wrote: | Girish hello,
interestingly there is difference in gail eod chart posted by u and the one that i find on icharts.
If I come to your chart the tristar as bottom reversal (as pointed by you) is already discounted.
Kindly consider following;
1. stock in lateral zone = 425- 460
2. Doji in uptrend
3. Upper end of lateral zone and 35 ema coincides.
4. Price congestion in 60min chart at upper level.
Thanks and Regards
Ravee |
Hi Ravee
You and Girish are viewing different scrips i.e. you are viewing chart of GAIL whereas Girish is viewing GAIL-1M charts. Hence there is difference in your findings
|
|
| Back to top |
|
 |
singh.ravee
Yellow Belt

Joined: 12 Aug 2010
Posts: 678
|
Post: #117  Posted: Sat Mar 05, 2011 5:30 pm Post subject: Posted: Sat Mar 05, 2011 5:30 pm Post subject: |
 |
|
Amit Hello,
thank u so much for your observation.
Girish, I think that more or less the observations regarding gail remains same.
Moreover, this tri star is not a strong reversal signal. Next bearish candle which closed below the low of tri star has nullified the effect, if any, of tri star.
Regards
Ravee
|
|
| Back to top |
|
 |
singh.ravee
Yellow Belt

Joined: 12 Aug 2010
Posts: 678
|
Post: #118  Posted: Sat Mar 05, 2011 5:47 pm Post subject: Posted: Sat Mar 05, 2011 5:47 pm Post subject: |
 |
|
Hello Everybody,
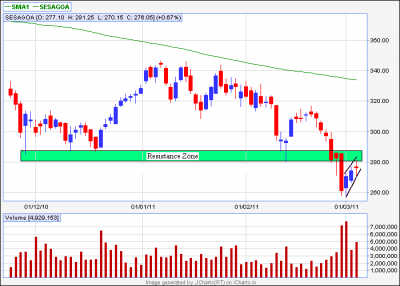
Sesa goa eod has some interesting observations.
1. A nicely defined hammer on 25 feb 2011.
2. A long bearish candle closes below hammer on 28 feb 2011. Acc to my limited knowledge it has nullified the reversal effect of hammer.
3. A pullback in stock. Seems like a bearish flag or rising wedge.
4. Doji appears close to resistance zone on 4 mar 2011.
5. A breakout below rising lower trendline can be used to enter short position.
Thanks and Regards
Ravee
| Description: |
|
| Filesize: |
19.8 KB |
| Viewed: |
475 Time(s) |
|
|
|
| Back to top |
|
 |
girishhu1
White Belt

Joined: 17 Aug 2009
Posts: 316
|
Post: #119  Posted: Sun Mar 06, 2011 8:53 am Post subject: Posted: Sun Mar 06, 2011 8:53 am Post subject: |
 |
|
hi ravee,
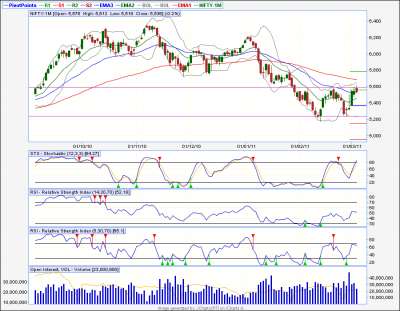
i think this is a potential upthrust pattern in making in nifty eod chart.As price could not sustain the new highs and closed down, nifty is going to test the lows made on 25/02/11. confirmation on curling down of stochastics. whats your view?
regards,
girish
| Description: |
|
| Filesize: |
59.01 KB |
| Viewed: |
484 Time(s) |
|
|
|
| Back to top |
|
 |
singh.ravee
Yellow Belt

Joined: 12 Aug 2010
Posts: 678
|
Post: #120  Posted: Sun Mar 06, 2011 9:43 am Post subject: Posted: Sun Mar 06, 2011 9:43 am Post subject: |
 |
|
Girish Hello,
For nifty I think downside is more probable as of now. I would like to go short on NF below 5520 for 5470 and then 5360.
Thanks and Regards
ravee
|
|
| Back to top |
|
 |
|

