| View previous topic :: View next topic |
| Do you think this thread would add value? |
| Yes |
|
93% |
[ 86 ] |
| No |
|
6% |
[ 6 ] |
|
| Total Votes : 92 |
|
| Author |
Candlestick Patterns... |
Padkondu
White Belt

Joined: 23 Jan 2008
Posts: 120
|
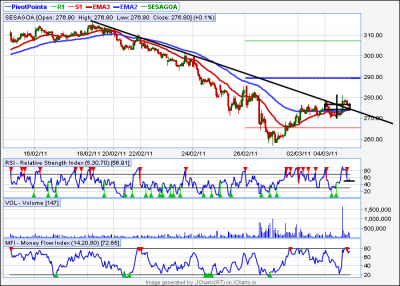
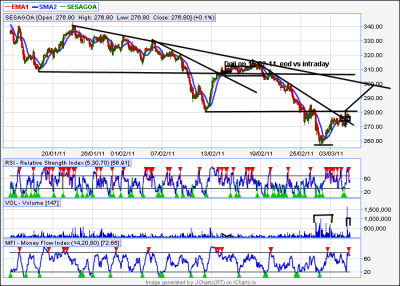
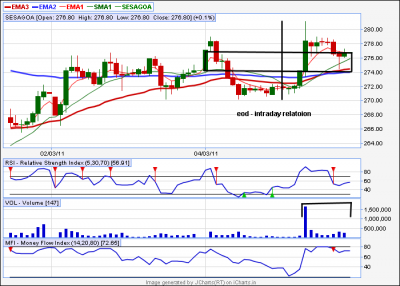
Post: #121  Posted: Sun Mar 06, 2011 12:46 pm Post subject: doji - sesagoa Posted: Sun Mar 06, 2011 12:46 pm Post subject: doji - sesagoa |
 |
|
| singh.ravee wrote: | Hello Everybody,
Sesa goa eod has some interesting observations.
1. A nicely defined hammer on 25 feb 2011.
2. A long bearish candle closes below hammer on 28 feb 2011. Acc to my limited knowledge it has nullified the reversal effect of hammer.
3. A pullback in stock. Seems like a bearish flag or rising wedge.
4. Doji appears close to resistance zone on 4 mar 2011.
5. A breakout below rising lower trendline can be used to enter short position.
Thanks and Regards
Ravee |
Dear friend,
let me put my view,
1. doji is neither a bullish reversal or bearish reversal pattern, on its own. it only indicates indecision. it could also be a continuation.
2. i support your view that it formed at a minor (weak) resistance, yet is is to be confirmed by the tomarrows price action.
3. i posted here three intraday charts, one with longer/shorter trend lines, price action of doji on intraday basis. i.e. break up of this doji.
4. the second half of the day's game went into the hands of bulls. that too, with convincing volumes. also check up the volume action while it is forming a v shaperd recovery.
5 what i finally say is, it is 60% probable that it goes up and 40% probable that it goes down.
have not any view on this basing on this doji. i say that i go long if the price moves above todays high + 12.5% of the todays range and stay long as long as todays low + 12.5% of todays range is not breached. and go short if it goes below todays low + 12.5% of todays range and stay short if the price stays below todays high - 12.5% of todays range.
regards
padkondu
| Description: |
|
| Filesize: |
36.74 KB |
| Viewed: |
508 Time(s) |
|
| Description: |
|
| Filesize: |
45.94 KB |
| Viewed: |
487 Time(s) |
|
| Description: |
|
| Filesize: |
28.02 KB |
| Viewed: |
469 Time(s) |
|
|
|
| Back to top |
|
 |
|
|
 |
singh.ravee
Yellow Belt

Joined: 12 Aug 2010
Posts: 678
|
Post: #122  Posted: Mon Mar 07, 2011 8:56 am Post subject: Posted: Mon Mar 07, 2011 8:56 am Post subject: |
 |
|
Padkondu Hello,
Doji per se is neutral. If today, bears roll the ball, then this doji which appeared at resistance will have bearish effect.
Acc to me a short in sesagoa can be initiated below 270.
Thanks and Regards
Ravee
|
|
| Back to top |
|
 |
singh.ravee
Yellow Belt

Joined: 12 Aug 2010
Posts: 678
|
Post: #123  Posted: Wed Mar 09, 2011 10:08 pm Post subject: Posted: Wed Mar 09, 2011 10:08 pm Post subject: |
 |
|
Hello Everybody,
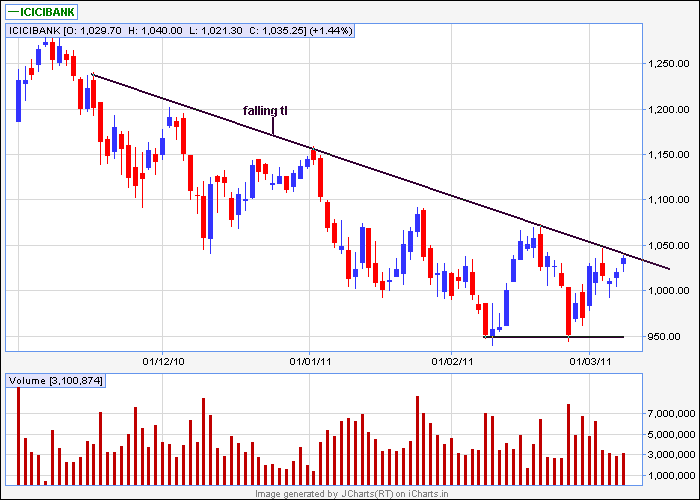
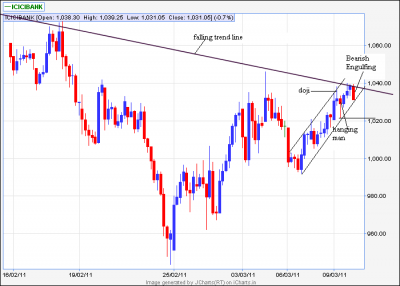
Few observations regarding icicibank.
1. Last 3 sessions; very small real bodies. normally opening gap up and then a very small movement throughout the day.
2. According to my limited knowledge, its something which should not be accompanied with gap up phenomenon. It represents weakness of bulls.
3. Falling trend line, 50ema and 200sma around 1040 level.
4. In 60min; a doji, followed by hanging man and then a bearish engulfing. Its all happening around 1040 level.
5. In 60min price is moving in channel.
6. According to my limited knowledge, one can go short if channel breaks on the downside. To be on the safer side, low of hanging man= 1020 can be another level of going short.
7. Remember, any major move above falling trendline will signal trend reversal. So only longs are favoured above it.
I request you all to share your valuable comments.
Thanks and Regards
Ravee
| Description: |
|
| Filesize: |
9.64 KB |
| Viewed: |
3027 Time(s) |
|
| Description: |
|
| Filesize: |
23.63 KB |
| Viewed: |
524 Time(s) |
|
|
|
| Back to top |
|
 |
Ravi_S
Yellow Belt

Joined: 15 Jun 2009
Posts: 569
|
Post: #124  Posted: Thu Mar 10, 2011 7:15 am Post subject: Posted: Thu Mar 10, 2011 7:15 am Post subject: |
 |
|
One more observation is that it has closed above both 50 and 200 DMA yesterday...
| singh.ravee wrote: | Hello Everybody,
Few observations regarding icicibank.
1. Last 3 sessions; very small real bodies. normally opening gap up and then a very small movement throughout the day.
2. According to my limited knowledge, its something which should not be accompanied with gap up phenomenon. It represents weakness of bulls.
3. Falling trend line, 50ema and 200sma around 1040 level.
4. In 60min; a doji, followed by hanging man and then a bearish engulfing. Its all happening around 1040 level.
5. In 60min price is moving in channel.
6. According to my limited knowledge, one can go short if channel breaks on the downside. To be on the safer side, low of hanging man= 1020 can be another level of going short.
7. Remember, any major move above falling trendline will signal trend reversal. So only longs are favoured above it.
I request you all to share your valuable comments.
Thanks and Regards
Ravee |
|
|
| Back to top |
|
 |
girishhu1
White Belt

Joined: 17 Aug 2009
Posts: 316
|
Post: #125  Posted: Thu Mar 10, 2011 2:16 pm Post subject: Posted: Thu Mar 10, 2011 2:16 pm Post subject: |
 |
|
heloow ravi,
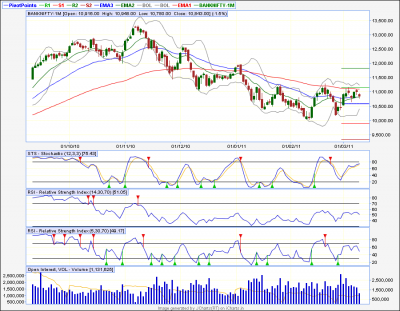
enclosing banknifty eod chart. is evening star in making?
also how to analyse the hammers formed on 6/7 march?
regards,
girish
| Description: |
|
| Filesize: |
59.52 KB |
| Viewed: |
491 Time(s) |
|
|
|
| Back to top |
|
 |
singh.ravee
Yellow Belt

Joined: 12 Aug 2010
Posts: 678
|
Post: #126  Posted: Thu Mar 10, 2011 2:40 pm Post subject: Posted: Thu Mar 10, 2011 2:40 pm Post subject: |
 |
|
Hello Girish,
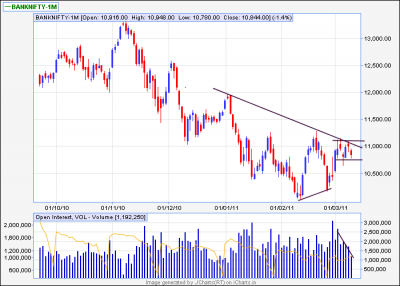
My observations on banknifty;
1. By definition it may be an evening star, however not appropriate; had it came after a fast upmove then this would have hold more significance.
2. If I analyse the overall picture, falling trendline, multiple moving averages, bearish signal all around 11000 level.
3. BNF is in kind of lateral move from last 6 sessions. Observe fall in volume which is also normal for lateral zones.
4. A higher bottom has been made. We need a higher top for trend reversal. If we manage to close somewhere above 11200- 11250 then its higher top
5. As of now a strong tug of war is going on between bulls and bears. It is justified also, since it can change the trend.
6. I will wait for breakout of zone for any trade in bank nifty.
Thanks and Regards
ravee
| Description: |
|
| Filesize: |
20.54 KB |
| Viewed: |
471 Time(s) |
|
|
|
| Back to top |
|
 |
singh.ravee
Yellow Belt

Joined: 12 Aug 2010
Posts: 678
|
Post: #127  Posted: Thu Mar 10, 2011 8:33 pm Post subject: Posted: Thu Mar 10, 2011 8:33 pm Post subject: |
 |
|
Hello Everybody,
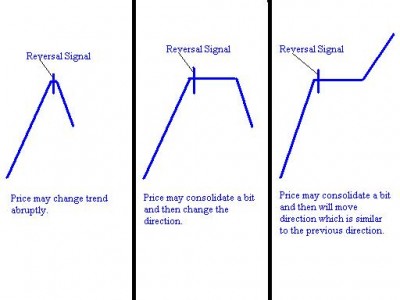
I would like to share with you something regarding candlestick reversal patterns. Price behave in 3 ways whenever reversal signals are encountered. Top Reversal is depicted in the attached, self explanatory picture.
Whenever trading candlestick reversals keep following in mind.
1. Reversal in simpler terms mean that current trend is halted. Per se, reversal signal is counter trend in nature. When price is changing trend, the risk is very high, however if spotted correctly reward will be very high.
2. I initiate trade only when reversal has happened or completed. I apply appropriate method to confirm the reversal.
3. These point was shared with me by "Sherbaaz Bhai".
4. Since I primarily trade candlestick reversals, I have benefitted from it significantly.
Thanks and Regards
Ravee
| Description: |
|
| Filesize: |
23.82 KB |
| Viewed: |
459 Time(s) |
|
|
|
| Back to top |
|
 |
singh.ravee
Yellow Belt

Joined: 12 Aug 2010
Posts: 678
|
Post: #128  Posted: Wed Mar 16, 2011 9:17 pm Post subject: Posted: Wed Mar 16, 2011 9:17 pm Post subject: |
 |
|
Hello Everybody,
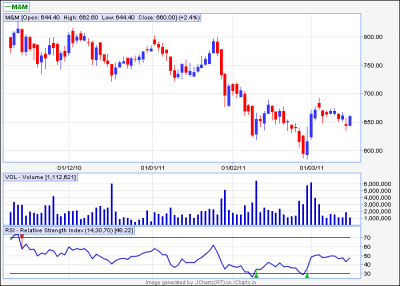
Would like to share M&M in eod.
1. Stock is in downtrend.
2. The last 3 candles have same implication as that of morning star. Although its not a morning star.
3. Doji created a higher low.
4. I would like to play it in shorter tf, if it crosses 663.
Thanks and Regards
Ravee
| Description: |
|
| Filesize: |
14.04 KB |
| Viewed: |
480 Time(s) |
|
|
|
| Back to top |
|
 |
girishhu1
White Belt

Joined: 17 Aug 2009
Posts: 316
|
Post: #129  Posted: Thu Mar 17, 2011 7:09 am Post subject: Posted: Thu Mar 17, 2011 7:09 am Post subject: |
 |
|
hi ravee,
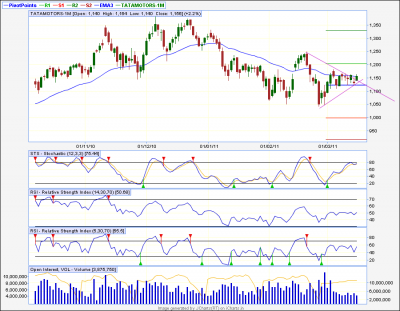
almost similar pattern seen in tata motors.
anyway why is it that the mnm pattern posted by you is not perfect morning star?
regards,
girish
| Description: |
|
| Filesize: |
49.64 KB |
| Viewed: |
493 Time(s) |
|
|
|
| Back to top |
|
 |
singh.ravee
Yellow Belt

Joined: 12 Aug 2010
Posts: 678
|
Post: #130  Posted: Thu Mar 17, 2011 8:46 am Post subject: Posted: Thu Mar 17, 2011 8:46 am Post subject: |
 |
|
Girish Hi,
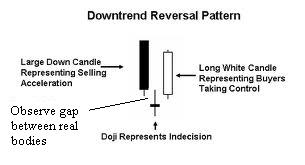
This is what morning star looks like. Second day could be doji or a small real body. Hope it suffice
Thanks and Regards
Ravee
| Description: |
|
| Filesize: |
9.09 KB |
| Viewed: |
3030 Time(s) |
|
|
|
| Back to top |
|
 |
singh.ravee
Yellow Belt

Joined: 12 Aug 2010
Posts: 678
|
Post: #131  Posted: Sat Mar 19, 2011 7:20 pm Post subject: Posted: Sat Mar 19, 2011 7:20 pm Post subject: |
 |
|
Hello Everybody,
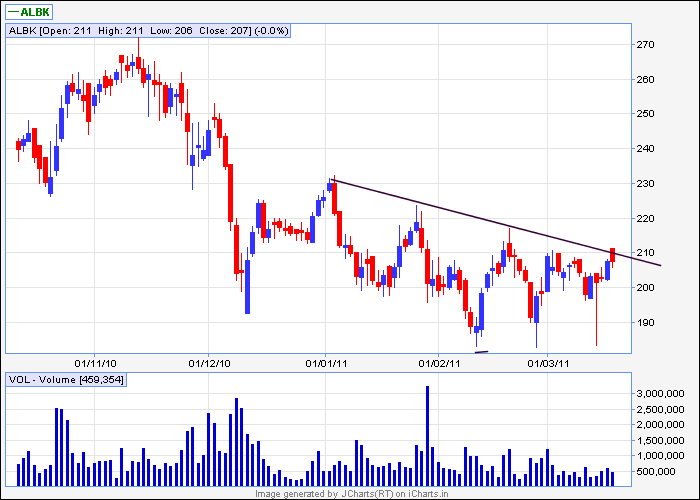
A bearish counter attack in allahabad bank. Multiple resistances around 210. Lets see whats next on monday.
Thanks and Regards
Ravee
| Description: |
|
| Filesize: |
11.44 KB |
| Viewed: |
3479 Time(s) |
|
|
|
| Back to top |
|
 |
singh.ravee
Yellow Belt

Joined: 12 Aug 2010
Posts: 678
|
Post: #132  Posted: Mon Mar 21, 2011 7:32 pm Post subject: Posted: Mon Mar 21, 2011 7:32 pm Post subject: |
 |
|
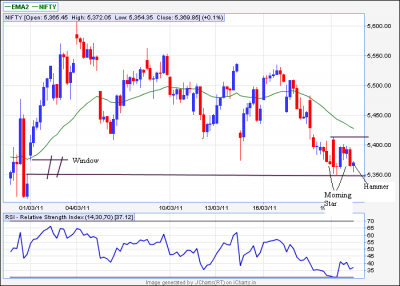
Hello Everybody,
Following points regarding in nifty spot.
1. Rising window = 5350 acting as support
2. Morning Star at support.
3. A Hammer at support.
4. One can think of going long around 5370 with sl of 5350 for first tgt of 5410. These numbers are for educational purpose.
Thanks and Regards
Ravee
| Description: |
|
| Filesize: |
31.87 KB |
| Viewed: |
517 Time(s) |
|
|
|
| Back to top |
|
 |
manojkr78
Green Belt

Joined: 07 Mar 2011
Posts: 1014
|
Post: #133  Posted: Tue Mar 22, 2011 3:18 pm Post subject: candelstick patterns on nifty spot Posted: Tue Mar 22, 2011 3:18 pm Post subject: candelstick patterns on nifty spot |
 |
|
Hi Ravee,
Could you please discuss your views on candelstick patterns on nifty spot everyday, this would help us a lot for learning the candlestics.....
|
|
| Back to top |
|
 |
singh.ravee
Yellow Belt

Joined: 12 Aug 2010
Posts: 678
|
Post: #134  Posted: Tue Mar 22, 2011 4:45 pm Post subject: Re: candelstick patterns on nifty spot Posted: Tue Mar 22, 2011 4:45 pm Post subject: Re: candelstick patterns on nifty spot |
 |
|
| manojkr78 wrote: | Hi Ravee,
Could you please discuss your views on candelstick patterns on nifty spot everyday, this would help us a lot for learning the candlestics..... |
Manoj Hello,
As and when any candlestick pattern will appear, I will surely share as per my limited knowledge.
Thanks and Regards
Ravee
|
|
| Back to top |
|
 |
sunrays
White Belt

Joined: 19 Dec 2009
Posts: 71
|
Post: #135  Posted: Wed Mar 23, 2011 12:19 am Post subject: Posted: Wed Mar 23, 2011 12:19 am Post subject: |
 |
|
gud job singh.ravee.
keep up the good work

cheers buddy
|
|
| Back to top |
|
 |
|

