| View previous topic :: View next topic |
| Do you think this thread would add value? |
| Yes |
|
93% |
[ 86 ] |
| No |
|
6% |
[ 6 ] |
|
| Total Votes : 92 |
|
| Author |
Candlestick Patterns... |
aryasumit15
White Belt

Joined: 06 Mar 2011
Posts: 1
|
Post: #136  Posted: Wed Mar 23, 2011 1:09 am Post subject: Jindal Saw Posted: Wed Mar 23, 2011 1:09 am Post subject: Jindal Saw |
 |
|
Hi Ravee,
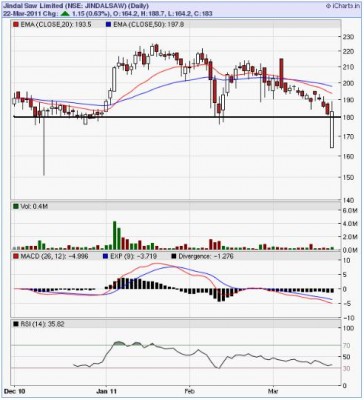
I am new to technical analysis, but followed this candlestick pattern forum and found it interesting. Wanted to share a pattern for Jindal Saw, where the 180 resistance is tested with a strong bullish counterattack line. Please share your thoughts on this.
And keep the good work going!
Cheers,
Sumit
| Description: |
|
| Filesize: |
48.36 KB |
| Viewed: |
496 Time(s) |

|
|
|
| Back to top |
|
 |
|
|
 |
singh.ravee
Yellow Belt

Joined: 12 Aug 2010
Posts: 678
|
Post: #137  Posted: Wed Mar 23, 2011 9:32 am Post subject: Posted: Wed Mar 23, 2011 9:32 am Post subject: |
 |
|
sumit hi,
nice find by you
following regarding jindal saw.
1. the low of 164 on eod is not visible in 60min or 15min. it can be due to other reasons.
2. area around 170 is a long term support
3. the stock bounced nicely today.
4. overall trend is down. i will prefer to look for opportunites to short.
thnx n rgds
ravee
|
|
| Back to top |
|
 |
singh.ravee
Yellow Belt

Joined: 12 Aug 2010
Posts: 678
|
Post: #138  Posted: Wed Mar 23, 2011 8:39 pm Post subject: Posted: Wed Mar 23, 2011 8:39 pm Post subject: |
 |
|
Hello everybody,
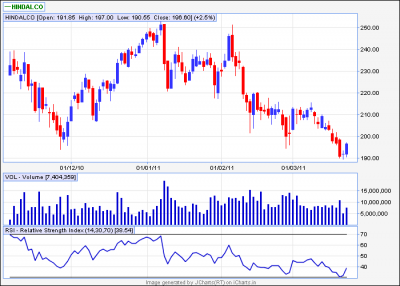
Earlier shared bullish divergence in hindalco 60min in "trading divergences" thread. Now its time for hindalco eod. Observe last 3 candles.
1. High vol tall bearish candle signalling end of this down rally.
2. Doji - balance between bulls and bears
3. Bullish candle - bulls took over.
4. 190 is a support.
5. those who entered with bullish divergence are enjoying it.
Thanks and Regards
Ravee
| Description: |
|
| Filesize: |
14.89 KB |
| Viewed: |
508 Time(s) |

|
|
|
| Back to top |
|
 |
S.S.
White Belt

Joined: 09 Feb 2011
Posts: 241
|
Post: #139  Posted: Fri Apr 01, 2011 9:33 am Post subject: Posted: Fri Apr 01, 2011 9:33 am Post subject: |
 |
|
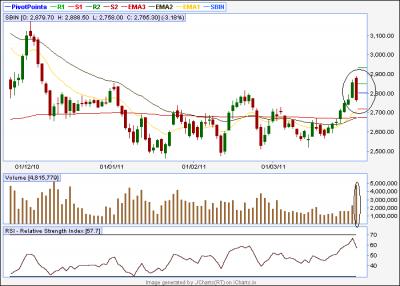
sbi
| Description: |
|
| Filesize: |
21.02 KB |
| Viewed: |
471 Time(s) |

|
|
|
| Back to top |
|
 |
deepakms
White Belt

Joined: 13 Aug 2009
Posts: 194
|
Post: #140  Posted: Fri Apr 01, 2011 9:47 am Post subject: Posted: Fri Apr 01, 2011 9:47 am Post subject: |
 |
|
Hi S.S,
The sbi charts indicates bearish engulf,not really sure though.
Can u confirm,if so what could it target on the down side ?
Rgds
Deepak
|
|
| Back to top |
|
 |
singh.ravee
Yellow Belt

Joined: 12 Aug 2010
Posts: 678
|
Post: #141  Posted: Fri Apr 01, 2011 9:48 am Post subject: Posted: Fri Apr 01, 2011 9:48 am Post subject: |
 |
|
S.S.
A very good find. Keep up the good work. 
Regards
Ravee
|
|
| Back to top |
|
 |
singh.ravee
Yellow Belt

Joined: 12 Aug 2010
Posts: 678
|
Post: #142  Posted: Fri Apr 01, 2011 9:50 am Post subject: Posted: Fri Apr 01, 2011 9:50 am Post subject: |
 |
|
| deepakms wrote: | Hi S.S,
The sbi charts indicates bearish engulf,not really sure though.
Can u confirm,if so what could it target on the down side ?
Rgds
Deepak |
Deepak,
its bearish signal in uptrend and should be used to liquidate longs. Try to find buying opportunity in SBI with this retracement.
Regards
Ravee
|
|
| Back to top |
|
 |
deepakms
White Belt

Joined: 13 Aug 2009
Posts: 194
|
Post: #143  Posted: Fri Apr 01, 2011 10:01 am Post subject: Posted: Fri Apr 01, 2011 10:01 am Post subject: |
 |
|
| Thnx Ravee, will do that
|
|
| Back to top |
|
 |
singh.ravee
Yellow Belt

Joined: 12 Aug 2010
Posts: 678
|
Post: #144  Posted: Sun Apr 03, 2011 9:42 am Post subject: Posted: Sun Apr 03, 2011 9:42 am Post subject: |
 |
|
Hello Everybody,
The beauty of candlesticks is that they can be combined with western TA tools. Combined together they are winning combination.
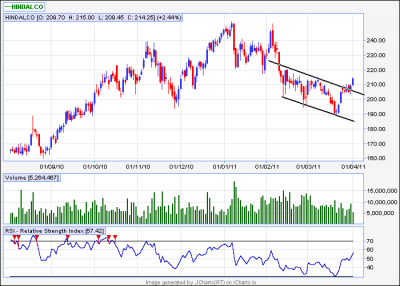
Continuing my efforts on hindalco from 195 levels; the divergence has pushed stock to 215 kind of level. Few additions;
1. A channel in Hindalco already broken on the upside
2. RSI is rising.
3. Here initial resistance is 215 beyond which 225 is possible.
Thanks and Regards
Ravee
| Description: |
|
| Filesize: |
13.3 KB |
| Viewed: |
538 Time(s) |

|
|
|
| Back to top |
|
 |
ridinghood
Yellow Belt

Joined: 16 Apr 2009
Posts: 724
|
Post: #145  Posted: Tue Apr 05, 2011 10:16 pm Post subject: Posted: Tue Apr 05, 2011 10:16 pm Post subject: |
 |
|
Dear Singh.Ravi
hi
ur nifty call posted on 21st march was simply awesome! therefrom nifty has gained a whopping 581pts from the lows of 5348!!! many2 thnx and congrats for the super call!
waiting for more such mouthwatering nifty updates from u,
regs
ridinghood
|
|
| Back to top |
|
 |
rachan03
White Belt

Joined: 30 Jul 2010
Posts: 8
|
Post: #146  Posted: Tue Apr 05, 2011 11:49 pm Post subject: Hanging man on nifty spot Posted: Tue Apr 05, 2011 11:49 pm Post subject: Hanging man on nifty spot |
 |
|
Dear Ravi,
today hanging man on nifty spot eod chart is formed ..its a bearish signal ..do we have to take any other confirmation ....wuts ur take on this ...how to trade it ...when one can go short positional in nifty ....5930 is also a TL resistance ... pls advise a stoploss & downside target ...thanks ....
|
|
| Back to top |
|
 |
singh.ravee
Yellow Belt

Joined: 12 Aug 2010
Posts: 678
|
Post: #147  Posted: Wed Apr 06, 2011 8:42 am Post subject: Re: Hanging man on nifty spot Posted: Wed Apr 06, 2011 8:42 am Post subject: Re: Hanging man on nifty spot |
 |
|
| rachan03 wrote: | Dear Ravi,
today hanging man on nifty spot eod chart is formed ..its a bearish signal ..do we have to take any other confirmation ....wuts ur take on this ...how to trade it ...when one can go short positional in nifty ....5930 is also a TL resistance ... pls advise a stoploss & downside target ...thanks .... |
Hi,
Hanging man requires confirmation. Confirmation can be market opens gap down and stays there or a close below hanging man's close.
I wish to go with trend. I would rather like to wait for a long opportunity during this retracement, if any.
If u wish to short then may be below 5850 for 5780- 5700- 5570
Thanks and Regards
Ravee
|
|
| Back to top |
|
 |
rachan03
White Belt

Joined: 30 Jul 2010
Posts: 8
|
Post: #148  Posted: Wed Apr 06, 2011 9:05 am Post subject: Hanging man on nifty spot Posted: Wed Apr 06, 2011 9:05 am Post subject: Hanging man on nifty spot |
 |
|
Dear Ravi,
one clarification required, you said "Confirmation can be market opens gap down and stays there or a close below hanging man's close"
...todays opening looks gap down ...
a close below hanging man's close or low is needed for confirmation .....
close level - 5910
low - 5856
please confirm ....thanks .
regards,
Rachan
|
|
| Back to top |
|
 |
singh.ravee
Yellow Belt

Joined: 12 Aug 2010
Posts: 678
|
Post: #149  Posted: Wed Apr 06, 2011 9:12 am Post subject: Posted: Wed Apr 06, 2011 9:12 am Post subject: |
 |
|
Rachan,
To the best of my knowledge any of the two can be used as confirmation
1. The greater the gapdown between the real body of hanging man day and the opening next day, the more likely that hanging man is a top.
2. Black real body session, with a lower close than the hangin man session's close.
Hope it suffice. Feel free to ask.
Thanks and Regards
Ravee
|
|
| Back to top |
|
 |
rachan03
White Belt

Joined: 30 Jul 2010
Posts: 8
|
Post: #150  Posted: Wed Apr 06, 2011 8:39 pm Post subject: Posted: Wed Apr 06, 2011 8:39 pm Post subject: |
 |
|
Dear Ravi,
as we were discussing hanging man in nifty spot eod .... today it has closed (5892) below hanging man's close level 5910 ...
is this confirmation sufficient for considering it a reversal signal ...pls confirm ....
hanging man's tail length is also good & its body is red ..which is a good sign ...
nifty daily & weekly chart is also facing resistance of downward Trendline near 5930 - 50 spot level .....
wuts your overall view ..... how about volume ?
|
|
| Back to top |
|
 |
|

