| View previous topic :: View next topic |
| Do you think this thread would add value? |
| Yes |
|
93% |
[ 86 ] |
| No |
|
6% |
[ 6 ] |
|
| Total Votes : 92 |
|
| Author |
Candlestick Patterns... |
sherbaaz
Yellow Belt

Joined: 27 May 2009
Posts: 543
|
Post: #16  Posted: Wed Feb 09, 2011 10:17 pm Post subject: Posted: Wed Feb 09, 2011 10:17 pm Post subject: |
 |
|
| chetan83 wrote: | | singh.ravee wrote: | Hi,
Is it a star in downtrend in nifty eod?? It appears at a long term support of 5250. Confirmation is still pending.
Lets c tomm n in days to come how it unfolds.
thanks n regards
ravee |
shud be followed with some oscillators.
I am just watching,
Regards,
Chetan. |
hi,
Rather than focusing and waiting for oscillators/indicators doing anything why dont you focus and see wht price is doing on the chart???
rest all are derivatives of price only.
Regards,
|
|
| Back to top |
|
 |
|
|
 |
singh.ravee
Yellow Belt

Joined: 12 Aug 2010
Posts: 678
|
Post: #17  Posted: Wed Feb 09, 2011 11:44 pm Post subject: Posted: Wed Feb 09, 2011 11:44 pm Post subject: |
 |
|
One of my close friend says that I should see my optometrist at the earliest.
He feels, whenever I look at charts, either I find triangles or stars.  
Woh subah kabhie to aayegi jab nifty mein morning star niklega.
Till then, take good care of your shorts. 
|
|
| Back to top |
|
 |
technocalls
White Belt

Joined: 27 Aug 2010
Posts: 34
|
Post: #18  Posted: Thu Feb 10, 2011 12:53 am Post subject: Posted: Thu Feb 10, 2011 12:53 am Post subject: |
 |
|
hi ravee,
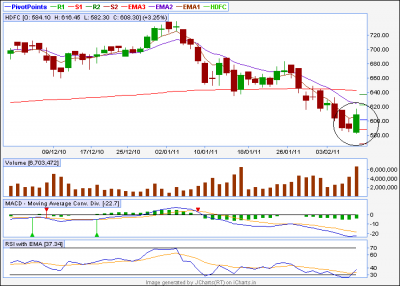
i thing HDFC get sucsess to make MS ....i suppose
have a look at chart
| Description: |
|
| Filesize: |
20.32 KB |
| Viewed: |
554 Time(s) |
|
|
|
| Back to top |
|
 |
sherbaaz
Yellow Belt

Joined: 27 May 2009
Posts: 543
|
Post: #19  Posted: Thu Feb 10, 2011 9:07 am Post subject: Posted: Thu Feb 10, 2011 9:07 am Post subject: |
 |
|
| technocalls wrote: | hi ravee,
i thing HDFC get sucsess to make MS ....i suppose
have a look at chart |
its not a morning star.
Regards,
|
|
| Back to top |
|
 |
technocalls
White Belt

Joined: 27 Aug 2010
Posts: 34
|
Post: #20  Posted: Thu Feb 10, 2011 9:30 am Post subject: Posted: Thu Feb 10, 2011 9:30 am Post subject: |
 |
|
| sherbaaz wrote: | | technocalls wrote: | hi ravee,
i thing HDFC get sucsess to make MS ....i suppose
have a look at chart |
its not a morning star.
Regards, |
....ok.....
|
|
| Back to top |
|
 |
sherbaaz
Yellow Belt

Joined: 27 May 2009
Posts: 543
|
Post: #21  Posted: Thu Feb 10, 2011 9:43 am Post subject: Posted: Thu Feb 10, 2011 9:43 am Post subject: |
 |
|
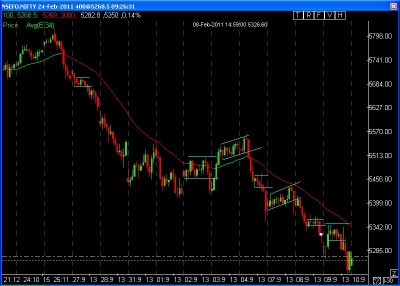
Hi All,
Posting the chart of 30 min tf nifty future NAKED CHART. Well i am not against indicators/oscillators but over a period of time I realized that trading naked would suit me more than any thing else and doing it i am focus only on PRICE ACTION.
I have pointed some short entries which i have taken from 27th Jan'11 till yday.
Regards,
| Description: |
|
| Filesize: |
66.28 KB |
| Viewed: |
647 Time(s) |
|
|
|
| Back to top |
|
 |
singh.ravee
Yellow Belt

Joined: 12 Aug 2010
Posts: 678
|
Post: #22  Posted: Thu Feb 10, 2011 12:11 pm Post subject: Posted: Thu Feb 10, 2011 12:11 pm Post subject: |
 |
|
Sherbaaz Bhai,
Around 2 years back when i started trading, I started with many indicators; %R, OBV, MACD, RSI and DMI(ADX), EMA crossover. I used to think myself as a super specialist of oscillators/ indicators.
As I progressed, everything failed except price.
As on date I trade only with EMA and RSI that too to capture divergence only.
Its my story. Someone else's story may or may not be different.
Regards
Ravee
|
|
| Back to top |
|
 |
sherbaaz
Yellow Belt

Joined: 27 May 2009
Posts: 543
|
Post: #23  Posted: Thu Feb 10, 2011 4:23 pm Post subject: Posted: Thu Feb 10, 2011 4:23 pm Post subject: |
 |
|
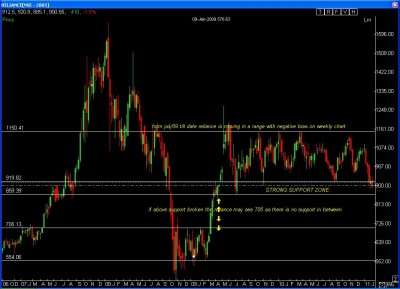
Reliance cash weekly chart.
Regards,
| Description: |
|
| Filesize: |
95.31 KB |
| Viewed: |
643 Time(s) |
|
|
|
| Back to top |
|
 |
technocalls
White Belt

Joined: 27 Aug 2010
Posts: 34
|
Post: #24  Posted: Thu Feb 10, 2011 9:39 pm Post subject: Posted: Thu Feb 10, 2011 9:39 pm Post subject: |
 |
|
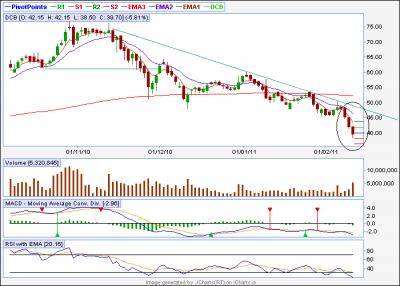
dcb with three crow???
| Description: |
|
| Filesize: |
21.35 KB |
| Viewed: |
602 Time(s) |
|
|
|
| Back to top |
|
 |
singh.ravee
Yellow Belt

Joined: 12 Aug 2010
Posts: 678
|
Post: #25  Posted: Fri Feb 11, 2011 8:40 am Post subject: Posted: Fri Feb 11, 2011 8:40 am Post subject: |
 |
|
Technocalls,
3 black crows is a top reversal pattern or is of significance if they come after an extended rally.
thanks and regards
ravee
|
|
| Back to top |
|
 |
sherbaaz
Yellow Belt

Joined: 27 May 2009
Posts: 543
|
Post: #26  Posted: Fri Feb 11, 2011 2:06 pm Post subject: Posted: Fri Feb 11, 2011 2:06 pm Post subject: |
 |
|
Hi All,
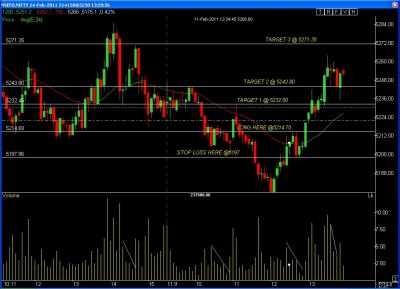
NF intraday long trade on 5 min tf. still waiting for tatget 3
regards,
| Description: |
|
| Filesize: |
109.13 KB |
| Viewed: |
602 Time(s) |
|
|
|
| Back to top |
|
 |
sherbaaz
Yellow Belt

Joined: 27 May 2009
Posts: 543
|
Post: #27  Posted: Fri Feb 11, 2011 2:36 pm Post subject: Posted: Fri Feb 11, 2011 2:36 pm Post subject: |
 |
|
| sherbaaz wrote: | Hi All,
NF intraday long trade on 5 min tf. still waiting for tatget 3
regards, |
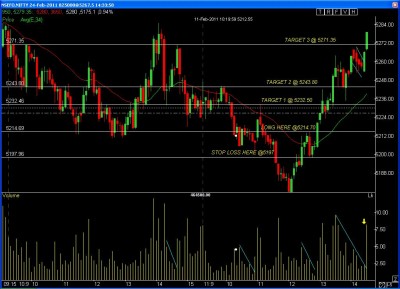
Target 3 done. See the contraction of price making a bullish flag and also with the bullish falg vol reduced.
the last current candle volume also given bo
Regards,
| Description: |
|
| Filesize: |
116.36 KB |
| Viewed: |
639 Time(s) |
|
|
|
| Back to top |
|
 |
Rahulsharmaat
Black Belt

Joined: 04 Nov 2009
Posts: 2766
|
Post: #28  Posted: Fri Feb 11, 2011 5:57 pm Post subject: Need your advice Posted: Fri Feb 11, 2011 5:57 pm Post subject: Need your advice |
 |
|
| How did u calculated the buy rate-- Stop loss as well as 3 tragets--please explain
|
|
| Back to top |
|
 |
rajshreed
White Belt

Joined: 25 Dec 2010
Posts: 8
|
Post: #29  Posted: Fri Feb 11, 2011 8:59 pm Post subject: kindly advice Posted: Fri Feb 11, 2011 8:59 pm Post subject: kindly advice |
 |
|
| sherbaaz wrote: | | sherbaaz wrote: | Hi All,
NF intraday long trade on 5 min tf. still waiting for tatget 3
regards, |
Target 3 done. See the contraction of price making a bullish flag and also with the bullish falg vol reduced.
the last current candle volume also given bo
Regards, |
Hello,
in the chart of NSEFO.NIFTY that you have just posted, i wanted to know why did u decide to go long only at 5214.70?
Just below the 5188 level at the right end of the chart you could see two consecutive long candles 1red and 1green. Don't they form a piercing pattern that could show an uptrend earlier?
regards
rajshree
|
|
| Back to top |
|
 |
singh.ravee
Yellow Belt

Joined: 12 Aug 2010
Posts: 678
|
Post: #30  Posted: Fri Feb 11, 2011 9:16 pm Post subject: Posted: Fri Feb 11, 2011 9:16 pm Post subject: |
 |
|
Hi,
2 question - one each from rajshreed and rahulsharmaat.
Feel like answering. Mann kar raha hai beech mein kood padoon.
Let Big Brother (Sherbaaz bhai) answer. May be I will learn something new.
|
|
| Back to top |
|
 |
|

