| View previous topic :: View next topic |
| Do you think this thread would add value? |
| Yes |
|
93% |
[ 86 ] |
| No |
|
6% |
[ 6 ] |
|
| Total Votes : 92 |
|
| Author |
Candlestick Patterns... |
Ravi_S
Yellow Belt

Joined: 15 Jun 2009
Posts: 569
|
Post: #31  Posted: Fri Feb 11, 2011 10:14 pm Post subject: Posted: Fri Feb 11, 2011 10:14 pm Post subject: |
 |
|
ravee... you go ahead with your analysis, let sherbaaz come with his explanation later... In a way it would be learning for everyone...
| singh.ravee wrote: | Hi,
2 question - one each from rajshreed and rahulsharmaat.
Feel like answering. Mann kar raha hai beech mein kood padoon.
Let Big Brother (Sherbaaz bhai) answer. May be I will learn something new. |
|
|
| Back to top |
|
 |
|
|
|
singh.ravee
Yellow Belt
Joined: 12 Aug 2010
Posts: 678
|
| Post: #32 Posted: Sat Feb 12, 2011 12:00 am Post subject: |
|
|
Hi,
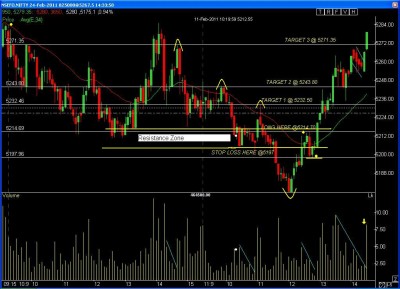
Piercing pattern variation which also is a bullish belt hold pattern appears as highlighted by V shape. Why a long was not initiated at this point?
Reason;
1. resistance = 5200 approx;
2. nifty in downtrend; trading below 34ema also below 50ema.
3. sl= difficult to establish or some arbitrary number (20pts, 30pts or 50pts). If this pattern fails, how low can we go is difficult to say.
3. reward = 13pts; risk = unlimited or some arbitrary number. Does not look like a good risk/reward.
My understanding on how entry was decided.
1. The reversal pattern highlighted by V shape pushed nifty up. Nifty tried to move above 34 ema and a recent high was created(yellow dot). Nifty retraced a bit and a recent low was created (yellow dot)
2. Tall bullish candle pierced resistance zone as well as 34 ema.
3. Since immediately previous trend was up so a long was initiated with sl = recent low (yellow dot)
4. Tgt = Previous Resistances as highlighted by inverted V shape
Open for valuable comments.
Thanks and regards
ravee
| Description: |
|
| Filesize: |
118.24 KB |
| Viewed: |
613 Time(s) |
|
Last edited by singh.ravee on Sat Feb 12, 2011 12:05 am; edited 1 time in total |
|
| Back to top |
|
|
technocalls
White Belt

Joined: 27 Aug 2010
Posts: 34
|
| Post: #33 Posted: Sat Feb 12, 2011 12:01 am Post subject: |
|
|
raveebhai, sherbaazbhai plz bare with me i m again going to post candle stick patterns. i m not good in T.A. like u but i will try my best to find the best...
thanks n regards
|
|
| Back to top |
|
|
technocalls
White Belt
Joined: 27 Aug 2010
Posts: 34
|
| Post: #34 Posted: Sat Feb 12, 2011 12:03 am Post subject: |
|
|
Last edited by technocalls on Sat Feb 12, 2011 12:13 am; edited 1 time in total |
|
| Back to top |
|
|
technocalls
White Belt
Joined: 27 Aug 2010
Posts: 34
|
| Post: #35 Posted: Sat Feb 12, 2011 12:11 am Post subject: |
|
|
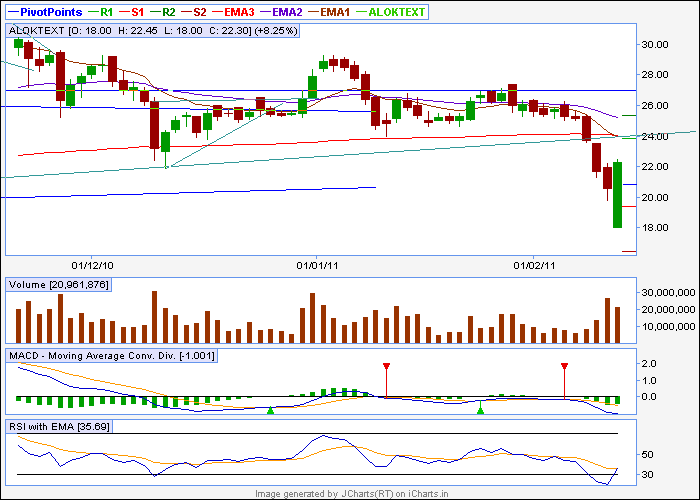
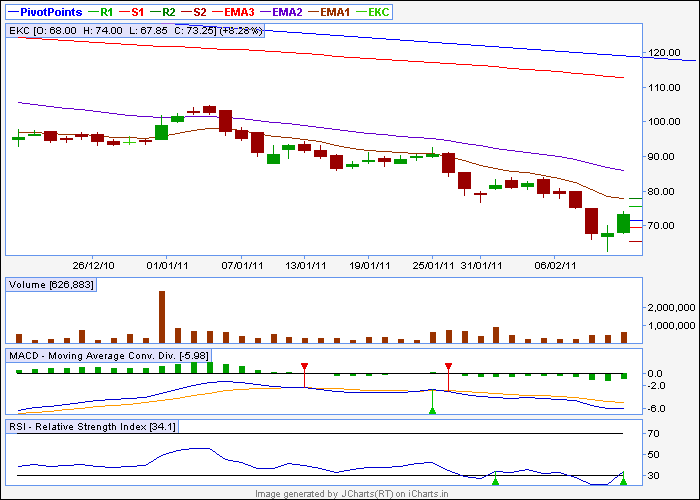
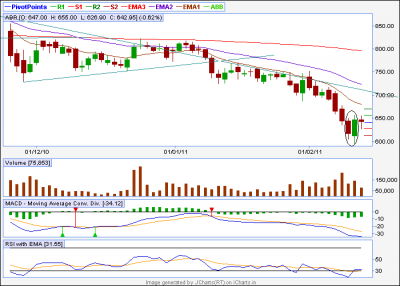
here i goes
ALOK TEXTILE - Bullish Englefinf
EKC-Mornig star
ABB- Bullish Englefing
| Description: |
|
| Filesize: |
10.44 KB |
| Viewed: |
3247 Time(s) |
|
| Description: |
|
| Filesize: |
8.06 KB |
| Viewed: |
3247 Time(s) |
|
| Description: |
|
| Filesize: |
19.51 KB |
| Viewed: |
557 Time(s) |
|
|
|
| Back to top |
|
|
singh.ravee
Yellow Belt
Joined: 12 Aug 2010
Posts: 678
|
| Post: #36 Posted: Sat Feb 12, 2011 12:13 am Post subject: |
|
|
technocalls,
go ahead with your work. i too started from the same step. shall i tell u a secret " i am a  and is still learning. I don't know from when icharts put "junior" with my name. and is still learning. I don't know from when icharts put "junior" with my name.
thank u icharts team for your gesture.
regards
ravee
|
|
| Back to top |
|
|
sherbaaz
Yellow Belt
Joined: 27 May 2009
Posts: 543
|
| Post: #37 Posted: Sat Feb 12, 2011 8:27 am Post subject: |
|
|
| singh.ravee wrote: | Hi,
Piercing pattern variation which also is a bullish belt hold pattern appears as highlighted by V shape. Why a long was not initiated at this point?
Reason;
1. resistance = 5200 approx;
2. nifty in downtrend; trading below 34ema also below 50ema.
3. sl= difficult to establish or some arbitrary number (20pts, 30pts or 50pts). If this pattern fails, how low can we go is difficult to say.
3. reward = 13pts; risk = unlimited or some arbitrary number. Does not look like a good risk/reward.
My understanding on how entry was decided.
1. The reversal pattern highlighted by V shape pushed nifty up. Nifty tried to move above 34 ema and a recent high was created(yellow dot). Nifty retraced a bit and a recent low was created (yellow dot)
2. Tall bullish candle pierced resistance zone as well as 34 ema.
3. Since immediately previous trend was up so a long was initiated with sl = recent low (yellow dot)
4. Tgt = Previous Resistances as highlighted by inverted V shape
Open for valuable comments.
Thanks and regards
ravee
|
Hi Ravee,
Thanks for yr analysis. well the thing is I even had not thought so much at the time of taking trade.
yes there was a piercing line at the bottom or at the low of the day now even if i go as per candle pattern u need to wait for one more candle to close above the high of the piercing candle, which next candle did as per candle stick pattern u can go long at the close of this candle.
for me its first signal of trend change on 5 min tf. after this candle pattern my bias was for long and started looking the opportunity.
i wanted price to close above 5200 and wanted to enter first retracement breakout. which did happen at 5214. Also chk the volume with retracement it went down. which was a good sign.
also down trend line broken at the point of entry.
i always wanted to have all the thee things at the time of entry.:
entry price
sl
exit points
exit points are base on probabilities. but at the time of trade it i dont get initial exit points of ref exit points i will not enter trade
.
ravee u r more or less right with regard to tgts.
Regards,
|
|
| Back to top |
|
|
sherbaaz
Yellow Belt
Joined: 27 May 2009
Posts: 543
|
| Post: #38 Posted: Sat Feb 12, 2011 8:36 am Post subject: |
|
|
| technocalls wrote: | here i goes
ALOK TEXTILE - Bullish Englefinf
EKC-Mornig star
ABB- Bullish Englefing |
Hi tehcnocalls,
You have spotted the patterns correctly but i will not trade them still all the three scrips are in down trend as per price action.
its looks very tempting to go in trade at the candle patterns as we normally feel we have got the holy grail (i always felt like tht). unfortunately its not the case.
if you see these candle patterns they are trend reversal means are counter trend in nature. most of the time they fail actually they dont fail we forget to spot the trend and fail to read the chart properly.
take it as a clue that trend may change from here and wait for trend change confirmation with what ever method you use. dont take short entry or cover yr short and sit aside and wait for trend to establish. and then go long.
very difficult thing to do and if there is a trend change you will curse me for suggesting you to sit aside and see the price to go up from this point in the process. But you cannot take all the trades and why to bet you capital on a trade where ODDS are not in you favor. GO ALONG WITH THE TREND.
Regards.
|
|
| Back to top |
|
|
singh.ravee
Yellow Belt
Joined: 12 Aug 2010
Posts: 678
|
| Post: #39 Posted: Sat Feb 12, 2011 9:46 am Post subject: |
|
|
Hi,
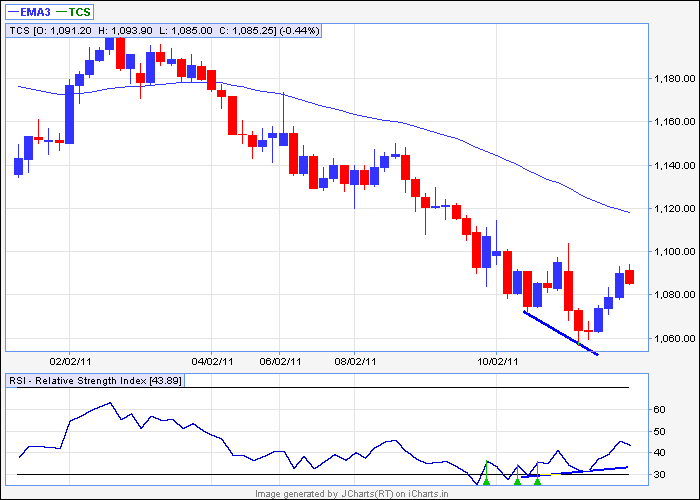
I am attaching 60min chart of tcs. It shows how candlesticks can be used with other T.A. tools.
A bullish divergence and a morning doji star variation at the same price range. Result = approx 15-20pts ride on 250 lot size.
My understanding says, its more of trading a pullback and not a reversal(morning doji star variation) because major trend is still down.
Thanks and Regards
Ravee.
| Description: |
|
| Filesize: |
9.75 KB |
| Viewed: |
2972 Time(s) |
|
|
|
| Back to top |
|
|
singh.ravee
Yellow Belt
Joined: 12 Aug 2010
Posts: 678
|
| Post: #40 Posted: Sat Feb 12, 2011 9:55 am Post subject: |
|
|
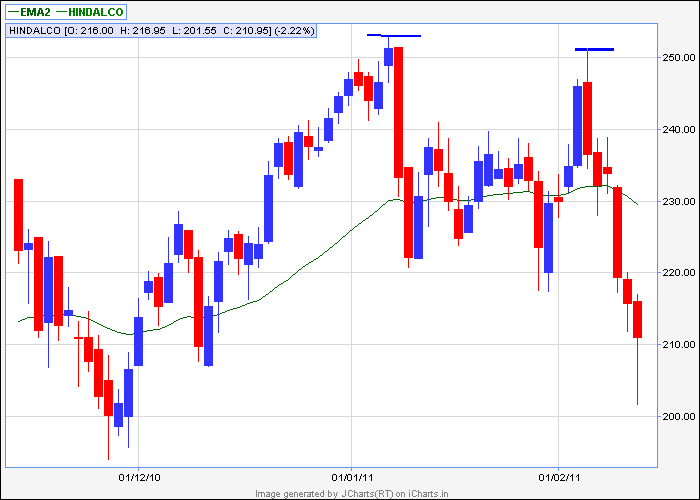
Ravi,
Hello,
Hindalco made a lower high in eod. Is it a signal that hindalco has reached the top of this current uptrend.
If yes, is shorting the stock as and when the opportunity comes is the best option to trade the stock.
Kindly share your valuable comments.
Thanks and Regards
ravee
| Description: |
|
| Filesize: |
7.98 KB |
| Viewed: |
3144 Time(s) |
|
|
|
| Back to top |
|
|
newinvestor
White Belt
Joined: 16 Feb 2010
Posts: 120
|
| Post: #41 Posted: Sat Feb 12, 2011 10:34 am Post subject: |
|
|
| singh.ravee wrote: | Sherbaaz Bhai,
As I progressed, everything failed except price.
As on date I trade only with EMA and RSI that too to capture divergence only.
Its my story. Someone else's story may or may not be different.
Regards
Ravee |
Ravee, when you say that you trade with only EMA, do you use any crossover technique? What time frames do you usually use and what EMAs? 34 , 50 etc?
|
|
| Back to top |
|
|
singh.ravee
Yellow Belt
Joined: 12 Aug 2010
Posts: 678
|
| Post: #42 Posted: Sat Feb 12, 2011 11:38 am Post subject: |
|
|
[quote="newinvestor
Ravee, when you say that you trade with only EMA, do you use any crossover technique? What time frames do you usually use and what EMAs? 34 , 50 etc?[/quote]
newinvestor,
i use 5- 35 ema crossover.
thanks and regards
ravee
|
|
| Back to top |
|
|
girishhu1
White Belt
Joined: 17 Aug 2009
Posts: 316
|
| Post: #43 Posted: Sat Feb 12, 2011 12:04 pm Post subject: |
|
|
| singh.ravee wrote: | Hi,
I am attaching 60min chart of tcs. It shows how candlesticks can be used with other T.A. tools.
A bullish divergence and a morning doji star variation at the same price range. Result = approx 15-20pts ride on 250 lot size.
My understanding says, its more of trading a pullback and not a reversal(morning doji star variation) because major trend is still down.
Thanks and Regards
Ravee. |
hi ravee,
just a contrarian view.
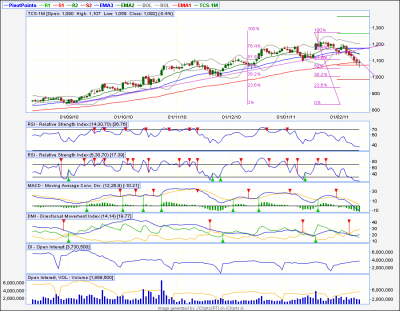
enclosing eod chart of tcs.
long term tl breached on 4/2/11 only in synch with market trend.
after quarterly results IT was only sector in bullish mode.
in case market attempts a rally IT should be one of the leaders.
in case of tcs , 34 ema has still not crossed below 89 ema though price is at 89 ema which is acting as support.further price has reversed after taking support at monthly s1.
i think there are more chances of upward rally now in tcs.
regards,
girish
| Description: |
|
| Filesize: |
63.13 KB |
| Viewed: |
580 Time(s) |
|
|
|
| Back to top |
|
|
singh.ravee
Yellow Belt
Joined: 12 Aug 2010
Posts: 678
|
| Post: #44 Posted: Sat Feb 12, 2011 12:18 pm Post subject: |
|
|
girishhu1,
My fault that i didn't clarified major trend appropriately. When i used the term major trend i meant down trend in 60min only.
This down trend when viewd on EOD chart constitutes part of the retracement from 52 week high.
As you have rightly pointed out, long term trend line is breached, however 34 ema is still above 50ema as well as 89ema and much above 200sma. All reasons to believe the major trend in EOD is still up.
Regards
ravee
|
|
| Back to top |
|
|
Trader
White Belt
Joined: 29 Jun 2008
Posts: 2
|
| Post: #45 Posted: Sun Feb 13, 2011 10:17 pm Post subject: Gitanjali recommended |
|
|
| Gitanjali is being recommended at profitablecandlestickcharting as a possible buy. good analysis for the past few weeks.
|
|
| Back to top |
|
|
|


