| View previous topic :: View next topic |
| Do you think this thread would add value? |
| Yes |
|
93% |
[ 86 ] |
| No |
|
6% |
[ 6 ] |
|
| Total Votes : 92 |
|
| Author |
Candlestick Patterns... |
sherbaaz
Yellow Belt

Joined: 27 May 2009
Posts: 543
|
Post: #46  Posted: Mon Feb 14, 2011 9:20 am Post subject: Posted: Mon Feb 14, 2011 9:20 am Post subject: |
 |
|
Hi All,
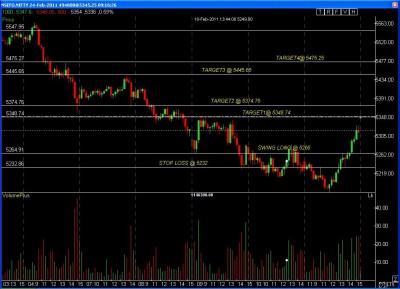
Attached 15 min tf nf chart for swing long with tgts and sl.
All tgts may not come but they act for me as probable exit points and help in keeping sl.
Regards,
| Description: |
|
| Filesize: |
110.94 KB |
| Viewed: |
569 Time(s) |

|
|
|
| Back to top |
|
 |
|
|
 |
sherbaaz
Yellow Belt

Joined: 27 May 2009
Posts: 543
|
Post: #47  Posted: Mon Feb 14, 2011 10:51 am Post subject: Posted: Mon Feb 14, 2011 10:51 am Post subject: |
 |
|
| sherbaaz wrote: | Hi All,
Attached 15 min tf nf chart for swing long with tgts and sl.
All tgts may not come but they act for me as probable exit points and help in keeping sl.
Regards, |
partial booking done at 5395.
regds,
|
|
| Back to top |
|
 |
Ravi_S
Yellow Belt

Joined: 15 Jun 2009
Posts: 569
|
Post: #48  Posted: Mon Feb 14, 2011 11:03 am Post subject: Posted: Mon Feb 14, 2011 11:03 am Post subject: |
 |
|
Is it the time to short NIFTY... It's been a long time since it touched 5 EMA in 60 mins TF... 5 EMA is at 5350 in NF 60 mins... 
Regards
Ravi
| sherbaaz wrote: | | sherbaaz wrote: | Hi All,
Attached 15 min tf nf chart for swing long with tgts and sl.
All tgts may not come but they act for me as probable exit points and help in keeping sl.
Regards, |
partial booking done at 5395.
regds, |
|
|
| Back to top |
|
 |
sherbaaz
Yellow Belt

Joined: 27 May 2009
Posts: 543
|
Post: #49  Posted: Mon Feb 14, 2011 11:14 am Post subject: Posted: Mon Feb 14, 2011 11:14 am Post subject: |
 |
|
[quote="Ravi_S"]Is it the time to short NIFTY... It's been a long time since it touched 5 EMA in 60 mins TF... 5 EMA is at 5350 in NF 60 mins... 
Regards
Ravi
I will not short nifty at this stage.
regds,
|
|
| Back to top |
|
 |
sherbaaz
Yellow Belt

Joined: 27 May 2009
Posts: 543
|
Post: #50  Posted: Mon Feb 14, 2011 11:16 am Post subject: Posted: Mon Feb 14, 2011 11:16 am Post subject: |
 |
|
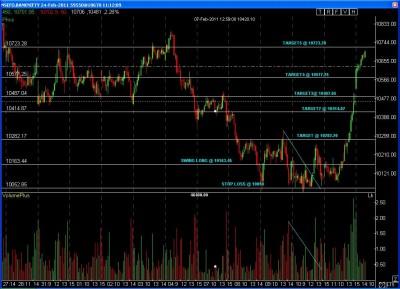
hi all,
Attached is the chart for bank nifty future of swing long 15 min tf
regds,
| Description: |
|
| Filesize: |
127.73 KB |
| Viewed: |
530 Time(s) |

|
|
|
| Back to top |
|
 |
chiragbvyas
White Belt

Joined: 18 Feb 2010
Posts: 469
|
Post: #51  Posted: Mon Feb 14, 2011 11:16 am Post subject: yahoo charts Posted: Mon Feb 14, 2011 11:16 am Post subject: yahoo charts |
 |
|
anybody can help me out how to use intraday charts at finance.yahoo.com ?
it takes too much time to get refreshed. or suggest any site where rates get faster refresh ?
|
|
| Back to top |
|
 |
casper
Green Belt

Joined: 02 Oct 2010
Posts: 1315
|
Post: #52  Posted: Mon Feb 14, 2011 11:21 am Post subject: Re: yahoo charts Posted: Mon Feb 14, 2011 11:21 am Post subject: Re: yahoo charts |
 |
|
| chiragbvyas wrote: | anybody can help me out how to use intraday charts at finance.yahoo.com ?
it takes too much time to get refreshed. or suggest any site where rates get faster refresh ? |
as far as i know (used atleast 1 yr ago,) it needs manual refresh, or else one can try google finance too. google is updated automatically
but thats a flash chart, cant be drawn any thing in that, icharts is far better
  
|
|
| Back to top |
|
 |
sherbaaz
Yellow Belt

Joined: 27 May 2009
Posts: 543
|
Post: #53  Posted: Mon Feb 14, 2011 11:22 am Post subject: Re: yahoo charts Posted: Mon Feb 14, 2011 11:22 am Post subject: Re: yahoo charts |
 |
|
| chiragbvyas wrote: | anybody can help me out how to use intraday charts at finance.yahoo.com ?
it takes too much time to get refreshed. or suggest any site where rates get faster refresh ? |
take ichart subscription you will get wht u want.
regds,
|
|
| Back to top |
|
 |
chiragbvyas
White Belt

Joined: 18 Feb 2010
Posts: 469
|
Post: #54  Posted: Mon Feb 14, 2011 11:52 am Post subject: thanks Posted: Mon Feb 14, 2011 11:52 am Post subject: thanks |
 |
|
| thanks a lot
|
|
| Back to top |
|
 |
sherbaaz
Yellow Belt

Joined: 27 May 2009
Posts: 543
|
Post: #55  Posted: Mon Feb 14, 2011 1:14 pm Post subject: Posted: Mon Feb 14, 2011 1:14 pm Post subject: |
 |
|
| sherbaaz wrote: | Hi All,
Attached 15 min tf nf chart for swing long with tgts and sl.
All tgts may not come but they act for me as probable exit points and help in keeping sl.
Regards, |
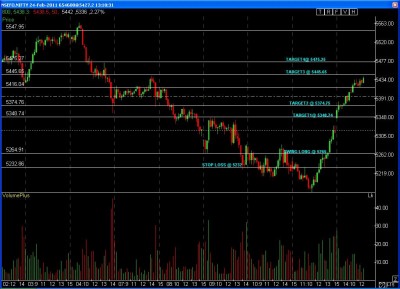
booked all at 5440.25. try to enter agin long on next opportunity
regds,
| Description: |
|
| Filesize: |
111.38 KB |
| Viewed: |
544 Time(s) |

|
|
|
| Back to top |
|
 |
singh.ravee
Yellow Belt

Joined: 12 Aug 2010
Posts: 678
|
Post: #56  Posted: Mon Feb 14, 2011 1:25 pm Post subject: Posted: Mon Feb 14, 2011 1:25 pm Post subject: |
 |
|
Sherbaaz bhai,
can u kindly share your views on "how to trail sl".
thanks and regards
ravee
|
|
| Back to top |
|
 |
singh.ravee
Yellow Belt

Joined: 12 Aug 2010
Posts: 678
|
Post: #57  Posted: Mon Feb 14, 2011 1:32 pm Post subject: Posted: Mon Feb 14, 2011 1:32 pm Post subject: |
 |
|
Ravi,
I think now its time for nifty to retrace a bit
1. 8 record high session.
2. 5440 a previous resistance
3. an open window = 5320. a test of window is likely.
thanks and regards
ravee
|
|
| Back to top |
|
 |
sherbaaz
Yellow Belt

Joined: 27 May 2009
Posts: 543
|
Post: #58  Posted: Mon Feb 14, 2011 1:33 pm Post subject: Posted: Mon Feb 14, 2011 1:33 pm Post subject: |
 |
|
| singh.ravee wrote: | Sherbaaz bhai,
can u kindly share your views on "how to trail sl".
thanks and regards
ravee |
hi,
previous resistance/tgt can be used for TSL look where consolidation/ congestion is happening.
although i dont use fibo but they are also good but the trick is to pick the right swing to find the retracement/expansion.
regards,
|
|
| Back to top |
|
 |
singh.ravee
Yellow Belt

Joined: 12 Aug 2010
Posts: 678
|
Post: #59  Posted: Mon Feb 14, 2011 1:38 pm Post subject: Posted: Mon Feb 14, 2011 1:38 pm Post subject: |
 |
|
sherbaaz bhai
thank u so much for your prompt reply
regards
ravee
|
|
| Back to top |
|
 |
sherbaaz
Yellow Belt

Joined: 27 May 2009
Posts: 543
|
Post: #60  Posted: Mon Feb 14, 2011 1:47 pm Post subject: Posted: Mon Feb 14, 2011 1:47 pm Post subject: |
 |
|
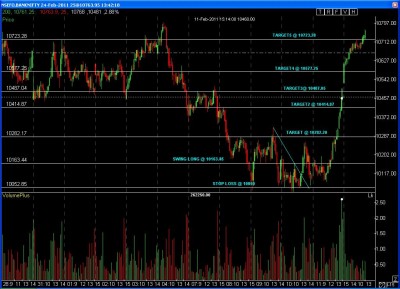
hi All,
All tgt achd in bnf closed all at 10740.
regds,
| Description: |
|
| Filesize: |
127.62 KB |
| Viewed: |
526 Time(s) |

|
|
|
| Back to top |
|
 |
|

