|
|
| View previous topic :: View next topic |
| Do you think this thread would add value? |
| Yes |
|
93% |
[ 86 ] |
| No |
|
6% |
[ 6 ] |
|
| Total Votes : 92 |
|
| Author |
Candlestick Patterns... |
sherbaaz
Yellow Belt

Joined: 27 May 2009
Posts: 543
|
Post: #61  Posted: Mon Feb 14, 2011 5:55 pm Post subject: Posted: Mon Feb 14, 2011 5:55 pm Post subject: |
 |
|
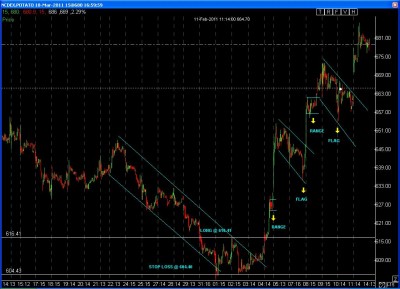
NCDEX POTATO 15 MIN TF CHART
Regards,
| Description: |
|
| Filesize: |
104.94 KB |
| Viewed: |
517 Time(s) |
|
|
|
| Back to top |
|
 |
|
|  |
singh.ravee
Yellow Belt

Joined: 12 Aug 2010
Posts: 678
|
Post: #62  Posted: Mon Feb 14, 2011 8:07 pm Post subject: Posted: Mon Feb 14, 2011 8:07 pm Post subject: |
 |
|
Hello,
I didnt find the original thread on short covering initiated by Ravi. So, I am posting it here.
Is it a short covering in nifty? Is a considerable downside still waiting?
My analysis is
1. 4th feb 2011 - a huge OI build up with fall in price - short build up
2. 8th n 9th feb 2011 - short build up using above criteria.
3. 14th feb 2011- decrease in OI with rise in price - short covering.
I think this rally is primarly due to short covering and some more downside is waiting.
Kindly share your valuable comments.
Thanks and Regards
Ravee
| Description: |
|

Download |
| Filename: |
Book1.xls |
| Filesize: |
15.5 KB |
| Downloaded: |
479 Time(s) |
|
|
| Back to top |
|
 |
casper
Green Belt

Joined: 02 Oct 2010
Posts: 1315
|
Post: #63  Posted: Mon Feb 14, 2011 8:30 pm Post subject: Posted: Mon Feb 14, 2011 8:30 pm Post subject: |
 |
|
| singh.ravee wrote: | Hello,
I didnt find the original thread on short covering initiated by Ravi. So, I am posting it here.
Is it a short covering in nifty? Is a considerable downside still waiting?
My analysis is
1. 4th feb 2011 - a huge OI build up with fall in price - short build up
2. 8th n 9th feb 2011 - short build up using above criteria.
3. 14th feb 2011- decrease in OI with rise in price - short covering.
I think this rally is primarly due to short covering and some more downside is waiting.
Kindly share your valuable comments.
Thanks and Regards
Ravee |
u r always doing good job, most importantly ur energy level is very high and u r always trying to apply what u r learning
this is the most important thing for a beginner like us, ( we have traders with 5,10,15 years or even more experience, our veru sir, according to anther website which lists experts, started trading in 1989, before these seniors, u and me are just toddlers)
i have a request for u, under the light of ur OI analysis, plz try to find clues in nifty chart and try to make a road map joining OI data u already interpreted and the chart data we have
our attempts might go wrong, but i feel this worths trying as by a trial and error method, we will reach to our goals
(i am not saying ur interpretation is wrong in any way, but i want u to find the supportive signal of ur interpretation from the chart too)
|
|
| Back to top |
|
 |
singh.ravee
Yellow Belt

Joined: 12 Aug 2010
Posts: 678
|
Post: #64  Posted: Mon Feb 14, 2011 8:55 pm Post subject: Posted: Mon Feb 14, 2011 8:55 pm Post subject: |
 |
|
casper,
Thanks so much for your suggestion. Would like to share with you;
1. resistance around 5530-5560
2. 200 dma = 5600. nifty approaching from downside.
3. volume is falling. When I saw volume part, i felt uncomfortable, so I looked into the OI data.
And whatever,little I understood from OI is what i posted earlier.
Keep sharing.
Regards
ravee
|
|
| Back to top |
|
 |
sherbaaz
Yellow Belt

Joined: 27 May 2009
Posts: 543
|
Post: #65  Posted: Mon Feb 14, 2011 9:42 pm Post subject: Posted: Mon Feb 14, 2011 9:42 pm Post subject: |
 |
|
| singh.ravee wrote: | casper,
Thanks so much for your suggestion. Would like to share with you;
1. resistance around 5530-5560
2. 200 dma = 5600. nifty approaching from downside.
3. volume is falling. When I saw volume part, i felt uncomfortable, so I looked into the OI data.
And whatever,little I understood from OI is what i posted earlier.
Keep sharing.
Regards
ravee |
hi,
good analysis but is it going to help you in trading?? there are so many things in ta tat u can keep on learning almost daily a new thing. the most common mistake which most of the ppl make in trading is that they start learning too much and unfortunately suffer of "ANALYSIS PARALYSIS" . trust me (you might not)the more u learn the less u trade . the less u know the more good trader u will be.
all this TA is good for learning but you have to decide wht do u want to do with this knowledge - TRADER OR ANALYST. both the fields are very different. one require too much of knowledge - THE ANALYST other require too much disicipline - THE TRADER.
this is wht I understand. i dont use all these stuff rather i stopped using them a while ago.
regards
|
|
| Back to top |
|
 |
casper
Green Belt

Joined: 02 Oct 2010
Posts: 1315
|
Post: #66  Posted: Mon Feb 14, 2011 10:14 pm Post subject: Posted: Mon Feb 14, 2011 10:14 pm Post subject: |
 |
|
| sherbaaz wrote: | | singh.ravee wrote: | casper,
Thanks so much for your suggestion. Would like to share with you;
1. resistance around 5530-5560
2. 200 dma = 5600. nifty approaching from downside.
3. volume is falling. When I saw volume part, i felt uncomfortable, so I looked into the OI data.
And whatever,little I understood from OI is what i posted earlier.
Keep sharing.
Regards
ravee |
hi,
good analysis but is it going to help you in trading?? there are so many things in ta tat u can keep on learning almost daily a new thing. the most common mistake which most of the ppl make in trading is that they start learning too much and unfortunately suffer of "ANALYSIS PARALYSIS" . trust me (you might not)the more u learn the less u trade . the less u know the more good trader u will be.
all this TA is good for learning but you have to decide wht do u want to do with this knowledge - TRADER OR ANALYST. both the fields are very different. one require too much of knowledge - THE ANALYST other require too much disicipline - THE TRADER.
this is wht I understand. i dont use all these stuff rather i stopped using them a while ago.
regards |
the best thing about ichartians that they speaks of their own experience and share the same with fresher peoples like me
yes, i do agree that for some peoples more information means more puzzle to solve
but for a person,who is essentially a day trader, things and views may differ a little also
yes, its a question of personal likings and whats more, a question of personal ability to analyse things and sort out which data is needed and which is not!
like the 200 sma part, which for a day trading seems a little distant one and hence of less value as of now, and for a fool like me, a divergence in lesser tf is of more importance
sorry if any body feels hurt
with warm regards
|
|
| Back to top |
|
 |
singh.ravee
Yellow Belt

Joined: 12 Aug 2010
Posts: 678
|
Post: #67  Posted: Mon Feb 14, 2011 10:40 pm Post subject: Posted: Mon Feb 14, 2011 10:40 pm Post subject: |
 |
|
Sherbaaz bhai,
thank u so much for being so candid in ur reply. Infact after reading casper's reply i thought of writing something. Typed the entire contents twice and didnt post it. I thought that it will be of no use to anyone. So here I go
"I often try to learn new things however fail to apply in-toto what i have already learnt. Its been more than 10 times that I have read triangle formation in edward magee and every time I wonder how come I encounter something new in those few pages. Point is as a trader, maintaining consistency and objectivity on day to day basis is very difficult. If I improve upon consistency and objectivity, things will improve drastically. So in short as a trader, being disciplined is more important."
thanks and regards
ravee
|
|
| Back to top |
|
 |
sherbaaz
Yellow Belt

Joined: 27 May 2009
Posts: 543
|
Post: #68  Posted: Tue Feb 15, 2011 8:13 am Post subject: Posted: Tue Feb 15, 2011 8:13 am Post subject: |
 |
|
| singh.ravee wrote: | Sherbaaz bhai,
thank u so much for being so candid in ur reply. Infact after reading casper's reply i thought of writing something. Typed the entire contents twice and didnt post it. I thought that it will be of no use to anyone. So here I go
"I often try to learn new things however fail to apply in-toto what i have already learnt. Its been more than 10 times that I have read triangle formation in edward magee and every time I wonder how come I encounter something new in those few pages. Point is as a trader, maintaining consistency and objectivity on day to day basis is very difficult. If I improve upon consistency and objectivity, things will improve drastically. So in short as a trader, being disciplined is more important."
thanks and regards
ravee |
the whole context of me writing is that you should stick to one/few things be it any thing any set up. if u r trading chart patterns stick to a few knowing all of them should not be yr short term objective knowing one of them to the T is the key and follow as it is dont make any addition/deletions in conditions. and practice it the more u practice the more easy it to become your SECOND NATURE.
the more you progress in your trading and the more you get exp (hope fully profitable) you will come to know that most of the things are one and the same, just having different names. i can quote you an eg trading retracement in trend as per chart pattern is FLAG. but ppl have different names.
you rightly put the things abt discipline. DONT BE AN EFFICIENT TRADER BE EFFECTIVE TRADER.
Regds,
|
|
| Back to top |
|
 |
singh.ravee
Yellow Belt

Joined: 12 Aug 2010
Posts: 678
|
Post: #69  Posted: Tue Feb 15, 2011 9:47 am Post subject: Posted: Tue Feb 15, 2011 9:47 am Post subject: |
 |
|
Sherbaaz bhai,
thank u so much for guidance.
regards
ravee
|
|
| Back to top |
|
 |
singh.ravee
Yellow Belt

Joined: 12 Aug 2010
Posts: 678
|
Post: #70  Posted: Tue Feb 15, 2011 9:58 am Post subject: Posted: Tue Feb 15, 2011 9:58 am Post subject: |
 |
|
Hi,
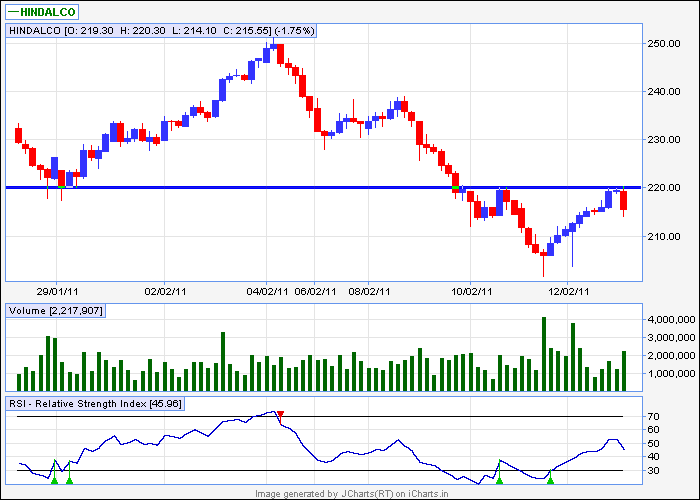
Evening doji star in hindalco 60min. taking entry with sl= 220 and tgt= 210- 203
Thanks and regards
ravee
| Description: |
|
| Filesize: |
10.42 KB |
| Viewed: |
2196 Time(s) |
|
|
|
| Back to top |
|
 |
singh.ravee
Yellow Belt

Joined: 12 Aug 2010
Posts: 678
|
Post: #71  Posted: Tue Feb 15, 2011 12:58 pm Post subject: Posted: Tue Feb 15, 2011 12:58 pm Post subject: |
 |
|
Hi,
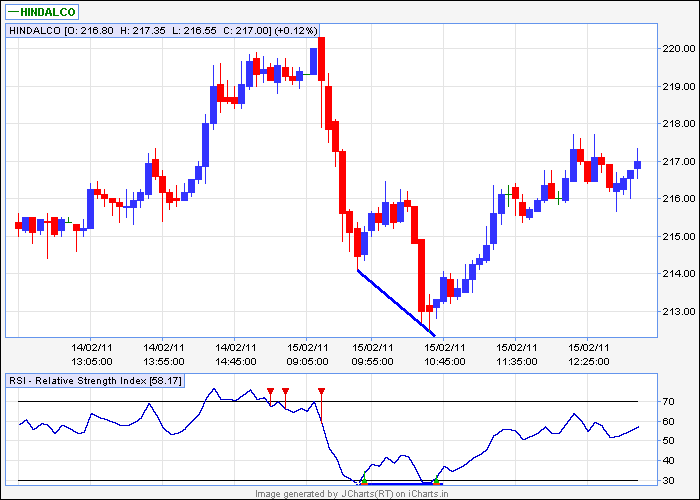
Saw this in hidalco 5min. Planned exit at 214.
thanks and regards
ravee
| Description: |
|
| Filesize: |
10.7 KB |
| Viewed: |
2281 Time(s) |
|
|
|
| Back to top |
|
 |
sherbaaz
Yellow Belt

Joined: 27 May 2009
Posts: 543
|
Post: #72  Posted: Tue Feb 15, 2011 1:36 pm Post subject: Posted: Tue Feb 15, 2011 1:36 pm Post subject: |
 |
|
| singh.ravee wrote: | Hi,
Saw this in hidalco 5min. Planned exit at 214.
thanks and regards
ravee |
with 60 min tf 5 min tf is too low to chk. if u r using 60 min tf as higher tf for lower tf use 15 min tf.
regds,
|
|
| Back to top |
|
 |
singh.ravee
Yellow Belt

Joined: 12 Aug 2010
Posts: 678
|
Post: #73  Posted: Tue Feb 15, 2011 1:44 pm Post subject: Posted: Tue Feb 15, 2011 1:44 pm Post subject: |
 |
|
sherbaaz,
point noted
thnx n rgds
ravee
|
|
| Back to top |
|
 |
singh.ravee
Yellow Belt

Joined: 12 Aug 2010
Posts: 678
|
Post: #74  Posted: Tue Feb 15, 2011 7:54 pm Post subject: Posted: Tue Feb 15, 2011 7:54 pm Post subject: |
 |
|
Hi,
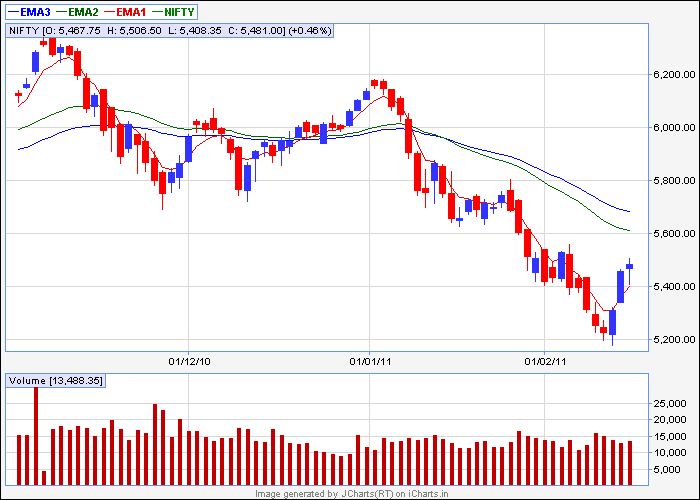
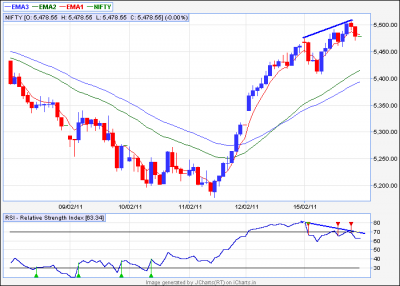
In nifty eod a star (can be viewed as doji also) appears today. Bearish divergence in nifty 30min. Need to be cautiously watch next trading session.
Thanks and Regards
ravee
| Description: |
|
| Filesize: |
10.29 KB |
| Viewed: |
2356 Time(s) |
|
| Description: |
|
| Filesize: |
12.95 KB |
| Viewed: |
459 Time(s) |
|
|
|
| Back to top |
|
 |
sherbaaz
Yellow Belt

Joined: 27 May 2009
Posts: 543
|
Post: #75  Posted: Wed Feb 16, 2011 11:12 am Post subject: Posted: Wed Feb 16, 2011 11:12 am Post subject: |
 |
|
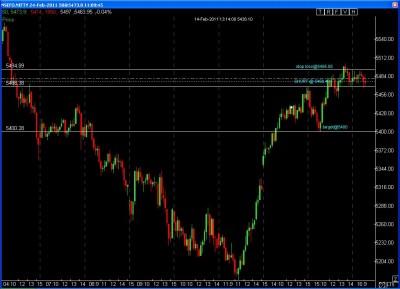
Shorted nf @ 5468.40 sl 5495.05 tgt 5400 on 15 min tf chart.
rgds,
| Description: |
|
| Filesize: |
87.79 KB |
| Viewed: |
452 Time(s) |
|
|
|
| Back to top |
|
 |
|
|
You cannot post new topics in this forum
You cannot reply to topics in this forum
You cannot edit your posts in this forum
You cannot delete your posts in this forum
You cannot vote in polls in this forum
You can attach files in this forum
You can download files in this forum
|
Powered by phpBB © 2001, 2005 phpBB Group
|
|
|

