| View previous topic :: View next topic |
| Do you think this thread would add value? |
| Yes |
|
93% |
[ 86 ] |
| No |
|
6% |
[ 6 ] |
|
| Total Votes : 92 |
|
| Author |
Candlestick Patterns... |
vinodgogia
White Belt

Joined: 28 Sep 2010
Posts: 20
|
Post: #76  Posted: Wed Feb 16, 2011 12:06 pm Post subject: How nicely you have mentioned people who investigate more ca Posted: Wed Feb 16, 2011 12:06 pm Post subject: How nicely you have mentioned people who investigate more ca |
 |
|
| casper wrote: | | sherbaaz wrote: | | singh.ravee wrote: | casper,
Thanks so much for your suggestion. Would like to share with you;
1. resistance around 5530-5560
2. 200 dma = 5600. nifty approaching from downside.
3. volume is falling. When I saw volume part, i felt uncomfortable, so I looked into the OI data.
And whatever,little I understood from OI is what i posted earlier.
Keep sharing.
Regards
ravee |
hi,
good analysis but is it going to help you in trading?? there are so many things in ta tat u can keep on learning almost daily a new thing. the most common mistake which most of the ppl make in trading is that they start learning too much and unfortunately suffer of "ANALYSIS PARALYSIS" . trust me (you might not)the more u learn the less u trade . the less u know the more good trader u will be.
all this TA is good for learning but you have to decide wht do u want to do with this knowledge - TRADER OR ANALYST. both the fields are very different. one require too much of knowledge - THE ANALYST other require too much disicipline - THE TRADER.
this is wht I understand. i dont use all these stuff rather i stopped using them a while ago.
regards |
the best thing about ichartians that they speaks of their own experience and share the same with fresher peoples like me
yes, i do agree that for some peoples more information means more puzzle to solve
but for a person,who is essentially a day trader, things and views may differ a little also
yes, its a question of personal likings and whats more, a question of personal ability to analyse things and sort out which data is needed and which is not!
like the 200 sma part, which for a day trading seems a little distant one and hence of less value as of now, and for a fool like me, a divergence in lesser tf is of more importance
sorry if any body feels hurt
with warm regards |
|
|
| Back to top |
|
 |
|
|
 |
sherbaaz
Yellow Belt

Joined: 27 May 2009
Posts: 543
|
Post: #77  Posted: Wed Feb 16, 2011 12:37 pm Post subject: Posted: Wed Feb 16, 2011 12:37 pm Post subject: |
 |
|
| sherbaaz wrote: | Shorted nf @ 5468.40 sl 5495.05 tgt 5400 on 15 min tf chart.
rgds, |
SL TRIGGERED.
regds,
|
|
| Back to top |
|
 |
singh.ravee
Yellow Belt

Joined: 12 Aug 2010
Posts: 678
|
Post: #78  Posted: Wed Feb 16, 2011 1:30 pm Post subject: Posted: Wed Feb 16, 2011 1:30 pm Post subject: |
 |
|
Sherbaaz,
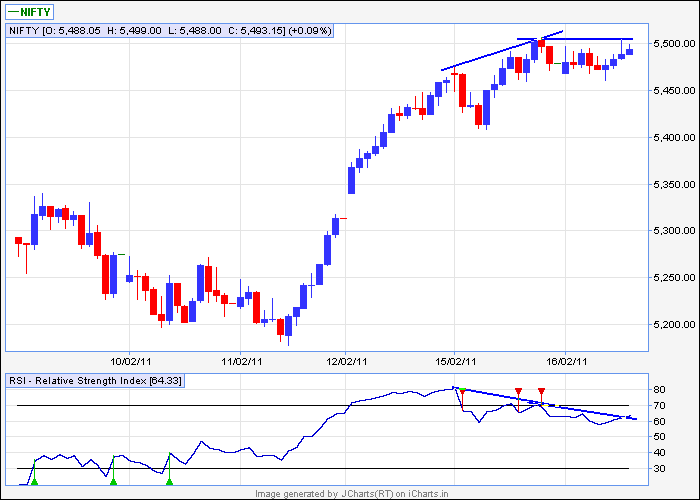
kindly consider this. double bearish divergence in nifty 30min
thanks and regards
ravee
| Description: |
|
| Filesize: |
9.61 KB |
| Viewed: |
2170 Time(s) |
|
|
|
| Back to top |
|
 |
singh.ravee
Yellow Belt

Joined: 12 Aug 2010
Posts: 678
|
Post: #79  Posted: Wed Feb 16, 2011 1:39 pm Post subject: Posted: Wed Feb 16, 2011 1:39 pm Post subject: |
 |
|
| P.S.: i m still sitting short on your call.
|
|
| Back to top |
|
 |
sherbaaz
Yellow Belt

Joined: 27 May 2009
Posts: 543
|
Post: #80  Posted: Wed Feb 16, 2011 2:00 pm Post subject: Posted: Wed Feb 16, 2011 2:00 pm Post subject: |
 |
|
| singh.ravee wrote: | | P.S.: i m still sitting short on your call. |
hi,
you should have quit as it hitted the SL @ 5494.05. why r u still holding it.
regarding divergence i dont trade it as i dont have much trust on them.
regds,
|
|
| Back to top |
|
 |
singh.ravee
Yellow Belt

Joined: 12 Aug 2010
Posts: 678
|
Post: #81  Posted: Wed Feb 16, 2011 2:34 pm Post subject: Posted: Wed Feb 16, 2011 2:34 pm Post subject: |
 |
|
Sherbaaz bhai,
I just wish to share that since i m convinced that bearish divergence will work thats why i have kept position open. Else i would have covered my position as soon as your message got flashed.
regards
ravee
|
|
| Back to top |
|
 |
singh.ravee
Yellow Belt

Joined: 12 Aug 2010
Posts: 678
|
|
| Back to top |
|
 |
singh.ravee
Yellow Belt

Joined: 12 Aug 2010
Posts: 678
|
Post: #83  Posted: Fri Feb 18, 2011 3:03 pm Post subject: Posted: Fri Feb 18, 2011 3:03 pm Post subject: |
 |
|
Sherbaaz,
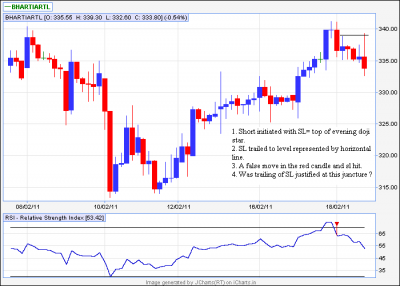
I am attaching 60min chart of bharti artl with my comments written on it.
Kindly share your observation
thanks and regards
ravee
| Description: |
|
| Filesize: |
20.66 KB |
| Viewed: |
518 Time(s) |
|
|
|
| Back to top |
|
 |
sherbaaz
Yellow Belt

Joined: 27 May 2009
Posts: 543
|
Post: #84  Posted: Fri Feb 18, 2011 3:35 pm Post subject: Posted: Fri Feb 18, 2011 3:35 pm Post subject: |
 |
|
| singh.ravee wrote: | Sherbaaz,
I am attaching 60min chart of bharti artl with my comments written on it.
Kindly share your observation
thanks and regards
ravee |
Hi,
First of all I would have not shorted it at the point of evening star this may be a trend changing or consolidation. could be any thing.
but yes as per candle stick evening star pattern you have shorted it rightly but you trailed yous sl too fast and its is actually as per me is not right u need to give price some room as they will not go down immediately once u shorted. most of the time there would be some consolidation/congestion and then fall may happen.
dont be hurry in a trade and try to understand what price is doing on chart. if you have taken a trade it is absolutely not necessary than it will start moving in your favor immediately.
take an example of your driving when u reach to some turn wht will u do??? you slow down the speed and in slow speed you will drive the vehicle and wait for the straight road to come. once on a straight road you will not put your vehicle in top gear slowly from first you move to 4th -5th gear along with increasing your speed. SAME ANALOGY YOU CAN SEE WHEN STOCKS ARE CHANGING ITS DIRECTION/TREND.
regds,
|
|
| Back to top |
|
 |
singh.ravee
Yellow Belt

Joined: 12 Aug 2010
Posts: 678
|
Post: #85  Posted: Fri Feb 18, 2011 4:11 pm Post subject: Posted: Fri Feb 18, 2011 4:11 pm Post subject: |
 |
|
sherbaaz,
thank you so much for your reply. I too felt that I hurried in trailing the SL.
Regards
ravee
|
|
| Back to top |
|
 |
sherbaaz
Yellow Belt

Joined: 27 May 2009
Posts: 543
|
Post: #86  Posted: Fri Feb 18, 2011 4:39 pm Post subject: Posted: Fri Feb 18, 2011 4:39 pm Post subject: |
 |
|
hi,
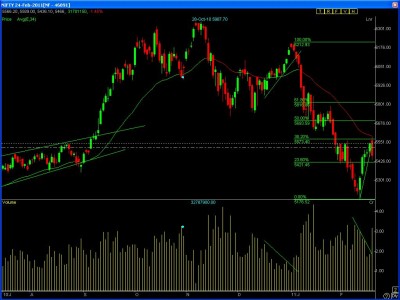
Attached is the chart of NF eod Couple of interesting things happened for which i was looking forward.
the up move which started from 5175 was having no volume or strength in its move.
today a bearish engulfing happened with good volume. price took resistance @ 38.2% of fibo.
regds,
| Description: |
|
| Filesize: |
111.46 KB |
| Viewed: |
554 Time(s) |
|
|
|
| Back to top |
|
 |
singh.ravee
Yellow Belt

Joined: 12 Aug 2010
Posts: 678
|
Post: #87  Posted: Fri Feb 18, 2011 5:31 pm Post subject: Posted: Fri Feb 18, 2011 5:31 pm Post subject: |
 |
|
Sherbaaz bhai,
For airtel u wrote "First of all I would have not shorted it at the point of evening star this may be a trend changing or consolidation. could be any thing."
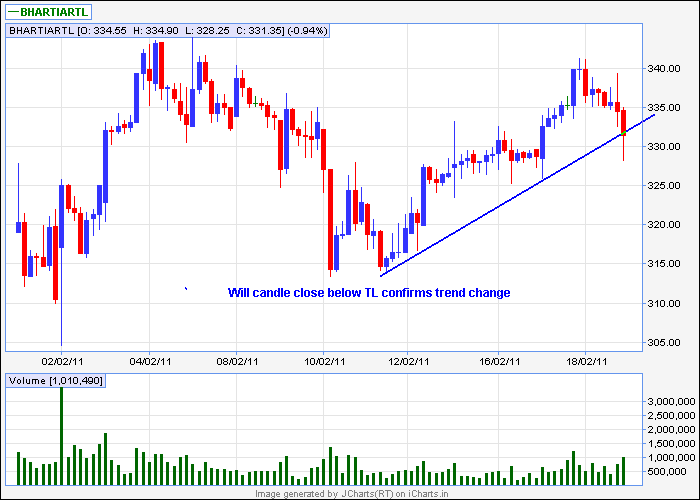
I have tried to draw a rising TL on 60min chart. If we close below TL then can we say that trend has changed. Is it the way to establish trend change or any other method is used?
Kindly share your valuable comments.
Please accomodate my numerous questions as I sincerely wish to clarify these things.
Thanks and Regards
Ravee
| Description: |
|
| Filesize: |
10.45 KB |
| Viewed: |
2258 Time(s) |
|
|
|
| Back to top |
|
 |
sherbaaz
Yellow Belt

Joined: 27 May 2009
Posts: 543
|
Post: #88  Posted: Fri Feb 18, 2011 6:43 pm Post subject: Posted: Fri Feb 18, 2011 6:43 pm Post subject: |
 |
|
Hi,
There are many ways to identify change in trend point or zone. one is candlesticks patterns another one which you have rightly said is trend line break out/ break down, which happened here. another one is divergence which i think you are trading mostly. and more methods which i do not have the knowledge or understanding.
as a trader we can either be a trend trader or a counter trend trader or a range trader. in all circumstances we need to know where is the trend and what is the trend. you have to decide yourself wht type of trader you want to be thn only you can focus in learning abt it.
good part and bad part about trend is that only 33% of time market/scrips remain in trend rest of the time they are trend less or range bound.
now when you are trading such trend changing zone/point using any method - RISK would be very high as you are going against the establish trend. but if spotted rightly reward will be very high. but that demands good positive experience.
to be on a safer side wait for trend to change and establish a new trend and thn trade in the direction of the trend.
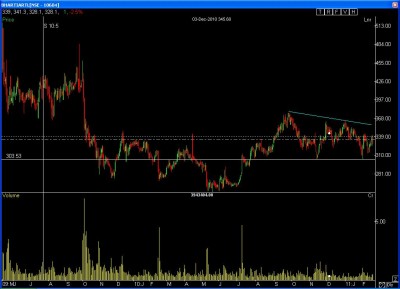
here evening star and trend is saying that trend is changing on 60 min TF chart from bullish to bearish. let it establish by a ways of BREAK DOWN of trend line and thn trade with the trend.
why i had said that i would have not traded it???
I am posting an EOD chart of BHARTIARTL decide yourself whether in higher TF like EOD is it TRENDING OR TRADING. as you are using 60 min tf make it habit of checking EOD chart also at the time of making decision.
Regds,
| Description: |
|
| Filesize: |
82.37 KB |
| Viewed: |
455 Time(s) |
|
|
|
| Back to top |
|
 |
singh.ravee
Yellow Belt

Joined: 12 Aug 2010
Posts: 678
|
Post: #89  Posted: Fri Feb 18, 2011 7:03 pm Post subject: Posted: Fri Feb 18, 2011 7:03 pm Post subject: |
 |
|
Sherbaaz Bhai,
Thank you so much.
Regards
Ravee
|
|
| Back to top |
|
 |
kanna
White Belt

Joined: 03 Jan 2010
Posts: 91
|
Post: #90  Posted: Fri Feb 18, 2011 8:46 pm Post subject: Posted: Fri Feb 18, 2011 8:46 pm Post subject: |
 |
|
| sherbaaz bhai your chart reading is excellent and also your explanation and replies. keep rocking
|
|
| Back to top |
|
 |
|

