| View previous topic :: View next topic |
| Do you think this thread would add value? |
| Yes |
|
93% |
[ 86 ] |
| No |
|
6% |
[ 6 ] |
|
| Total Votes : 92 |
|
| Author |
Candlestick Patterns... |
Ravi_S
Yellow Belt

Joined: 15 Jun 2009
Posts: 569
|
Post: #1  Posted: Fri Feb 04, 2011 10:12 pm Post subject: Candlestick Patterns... Posted: Fri Feb 04, 2011 10:12 pm Post subject: Candlestick Patterns... |
 |
|
Guys,
We have few threads where we are discussing strategies. But I see there is a thread missing which is dedicated to Candlesticks. Anyone who sees some good patterns or traded some patterns on a given day can post their findings/results here. Hope this thread would invoke interest among everyone and hope this thread rocks as lots of other threads here..
So, what to wait for, start firing  .... ....
Regards
Ravi
|
|
| Back to top |
|
 |
|
|
|
amitkbaid1008
Yellow Belt
Joined: 04 Mar 2009
Posts: 540
|
| Post: #2 Posted: Fri Feb 04, 2011 10:39 pm Post subject: |
|
|
Hi Ravi
In my view these patterns fail more than they succeed. Particularly reversal patterns because they go against the trend. They are more successful when they are used in combination with trend.
In my opinion these patterns should be followed when they support major trend.
|
|
| Back to top |
|
|
singh.ravee
Yellow Belt
Joined: 12 Aug 2010
Posts: 678
|
| Post: #3 Posted: Fri Feb 04, 2011 11:21 pm Post subject: |
|
|
Ravi,
Another good initiative by you. For me its a wish come true.
Hope to have many rocking candlestick chart patterns posted in this thread.
Regards
ravee
P.S: Sherbaaz bhai ravi ne aapka kaam bahut asaan kar diya. 
|
|
| Back to top |
|
|
singh.ravee
Yellow Belt
Joined: 12 Aug 2010
Posts: 678
|
| Post: #4 Posted: Fri Feb 04, 2011 11:54 pm Post subject: |
|
|
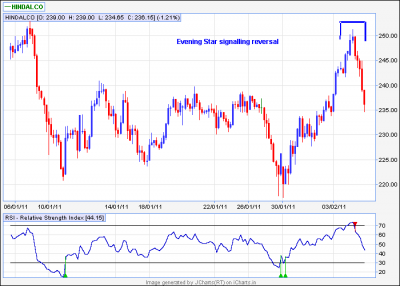
amitkbaid1008
Acc to my limited knowledge, best use of candlesticks is to gauge a reversal. If these reversal signal comes at previous support or resistance, its an added advantage.
I am posting chart of hindalco 60min as case in point.
Thanks and Regards
Ravee
| Description: |
|
| Filesize: |
11.8 KB |
| Viewed: |
1051 Time(s) |
|
|
|
| Back to top |
|
|
singh.ravee
Yellow Belt
Joined: 12 Aug 2010
Posts: 678
|
| Post: #5 Posted: Sat Feb 05, 2011 12:13 am Post subject: |
|
|
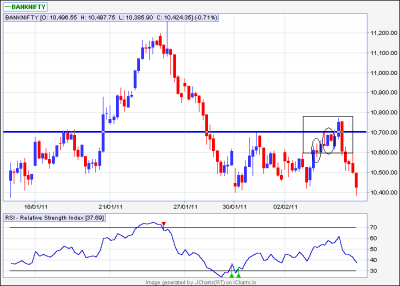
Hi,
The best use of candlesticks as reversal pattern was evident in banknifty 60min. I am sharing my personal experience only.
Day 1 starts.
1. 10700 is an old resistance.
2. A doji appeared in uptrend after a tall bullish candle. First signal that bulls are loosing force. Marked in first oval.
3. Next candle is bullish candle. seems bulls again took over.
4. Gravestone doji appears. Marked in second oval. Let me think twice; are bulls still in control? Remember when it all was happening nifty was trending upwards
5. Immediately followed by bearish harami. Marked in second oval.
Day 1 ends
Day 2 starts.
1. Bank nifty starts moving up; crosses 10700. Question of the trade: When I should go long in bank nifty?
Answer: If bank nifty tests 10700 from upside.
2. A candle which completes at 1200pm is a tall bearish candle. Its a bearish engulfing pattern also. Moreover it engulfs 7 previous candles.
What else can I expect from candlestick patterns. Since, I was short in Hindalco, so I could not trade it personally. However, advised one of a friend to open short= 10600; He could earn more than 180 pts.
Also note, that I have not used any indicator to reach upon the conclusion. However, If any indicator, supports candlestick pattern, its always an add on.
Regards
Ravee
| Description: |
|
| Filesize: |
21.71 KB |
| Viewed: |
937 Time(s) |
|
|
|
| Back to top |
|
|
amitkbaid1008
Yellow Belt
Joined: 04 Mar 2009
Posts: 540
|
| Post: #6 Posted: Sat Feb 05, 2011 9:49 am Post subject: |
|
|
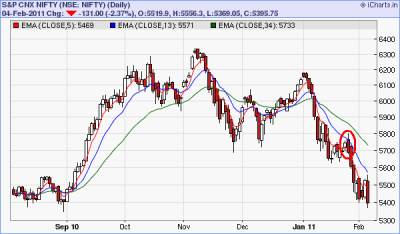
Hi Ravee
Here comes the problems in using Candlestick patterns.
First one is about identification of pattern i the instant case the first pattern on BANKNIFTY you observed is a DOJI but for me thats like spinning top that too bearish because it was black spinning top.
Another pattern you identified is GRAVE STINE DOJI for you but for me that's Inverted Hammer although both are to be considered as bearish
Next pattern you identified is BEARISH HARAMI but for me there is no pattern.
Last pattern was a BEARISH ENGULFING
But out of 3 (as per me) and 4 (as per you) bearish signal one signal worked. That's why I said these pattern fails too often than they succeed.
I am posting a chart of NIFTY where I marked a BEARISH ENGULFING pattern on EOD charts. The trend was down and NIFTY was retracing and such candle to end the retracement was good signal of resuming major trend.
The candlestick patterns should be used in combination with trend only.
| Description: |
|
| Filesize: |
30.09 KB |
| Viewed: |
872 Time(s) |
|
|
|
| Back to top |
|
|
sherbaaz
Yellow Belt
Joined: 27 May 2009
Posts: 543
|
| Post: #7 Posted: Sat Feb 05, 2011 10:42 am Post subject: |
|
|
| amitkbaid1008 wrote: | Hi Ravee
Here comes the problems in using Candlestick patterns.
First one is about identification of pattern i the instant case the first pattern on BANKNIFTY you observed is a DOJI but for me thats like spinning top that too bearish because it was black spinning top.
Another pattern you identified is GRAVE STINE DOJI for you but for me that's Inverted Hammer although both are to be considered as bearish
Next pattern you identified is BEARISH HARAMI but for me there is no pattern.
Last pattern was a BEARISH ENGULFING
But out of 3 (as per me) and 4 (as per you) bearish signal one signal worked. That's why I said these pattern fails too often than they succeed.
I am posting a chart of NIFTY where I marked a BEARISH ENGULFING pattern on EOD charts. The trend was down and NIFTY was retracing and such candle to end the retracement was good signal of resuming major trend.
The candlestick patterns should be used in combination with trend only. |
HI Amit,
Any thing and everything works in TA provided we know how its works. the basic problem is that we jump on to the results not the the process of how things are working.
in case of candlesticks, basic premise which most of the people dont know or tend to ignore is that the premise of CANDLESTICKS CHARTING is PSYCHOLOGY. its this foundation on which candlesticks are based. candlesticks are not only about patterns, signals and all they are part of candlesticks.
Most of the people are using various indicators/oscillators. but how many of us know their premises. for eg how many of use take pain to calculate RSI manually to understand it? we read the definition leave the calculation and back test them as think we know it to use it .
Regards,
|
|
| Back to top |
|
|
singh.ravee
Yellow Belt
Joined: 12 Aug 2010
Posts: 678
|
| Post: #8 Posted: Sat Feb 05, 2011 11:04 am Post subject: |
|
|
Hi,
As pointed aptly by Sherbaaz, Candles capture psychology.
First 3 signals as seen by me were telling only one thing that something is wrong with this uptrend in banknifty. We need fresh buying for a true uptrend to begin. The bearish engulfing confirmed that bulls are not in-charge of bank nifty.
I am pasting a text from a book written by Steve Nison
An important principle is to place a new position, only if, that signal is in the direction of the major trend. For example, in a bull market, a top reversal pattern appears. This bearish signal should not warrant a short sale, because the major trend is still up. It would however signal a liquidation of longs. If the prevailing trend is downtrend, then this same top reversal formation could be used to place short sales.
Thanks and Regards
Ravee
|
|
| Back to top |
|
|
singh.ravee
Yellow Belt
Joined: 12 Aug 2010
Posts: 678
|
| Post: #9 Posted: Sat Feb 05, 2011 8:02 pm Post subject: |
|
|
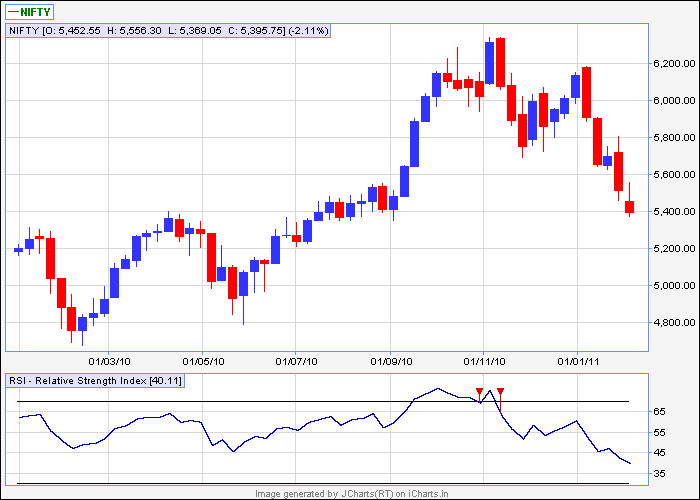
Hi,
This chart was first pointed by "Technocalls". I thought its an important signal and should be posted in this thread for further comments.
For me its a star; first hint of bottom; its incomplete so any logical conclusion can be drawn only by the end of coming week.
Thanks and Regards
Ravee
| Description: |
|
| Filesize: |
9.46 KB |
| Viewed: |
10979 Time(s) |
|
|
|
| Back to top |
|
|
technocalls
White Belt

Joined: 27 Aug 2010
Posts: 34
|
| Post: #10 Posted: Sat Feb 05, 2011 9:12 pm Post subject: |
|
|
| i thing sharebaazbhai should throw some light on it ....
|
|
| Back to top |
|
|
singh.ravee
Yellow Belt
Joined: 12 Aug 2010
Posts: 678
|
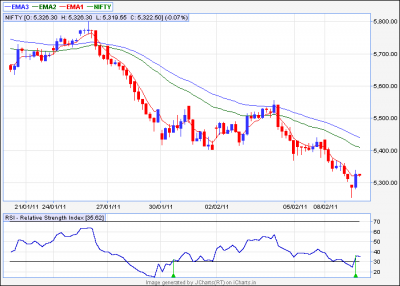
| Post: #11 Posted: Wed Feb 09, 2011 11:09 am Post subject: |
|
|
Hi,
A nicely defined hammer at long term support = 5250. Hammer was able to get confirmation also.
One can think of going long around 5300-5320 with sl= 5250; tgt= 5440 - 5560.
thanks and regards
ravee
| Description: |
|
| Filesize: |
12.72 KB |
| Viewed: |
675 Time(s) |
|
|
|
| Back to top |
|
|
chetan83
Brown Belt

Joined: 19 Feb 2010
Posts: 2037
|
| Post: #12 Posted: Wed Feb 09, 2011 1:09 pm Post subject: |
|
|
| singh.ravee wrote: | Hi,
A nicely defined hammer at long term support = 5250. Hammer was able to get confirmation also.
One can think of going long around 5300-5320 with sl= 5250; tgt= 5440 - 5560.
thanks and regards
ravee |
Hi,
Really a challenging pattern on 60 mins bottom "Hammer". Hope, if this holds true then I'll be surely a true fan of candlestick or else 
Regards,
Chetan.
|
|
| Back to top |
|
|
singh.ravee
Yellow Belt
Joined: 12 Aug 2010
Posts: 678
|
| Post: #13 Posted: Wed Feb 09, 2011 5:11 pm Post subject: |
|
|
Chetan,
We all know that nothing works all the time. Kindly do not draw any conclusion based on one chart. Let me post atleast a dozen charts and then analyse the success rate of candlestick.
Regards
ravee
|
|
| Back to top |
|
|
singh.ravee
Yellow Belt
Joined: 12 Aug 2010
Posts: 678
|
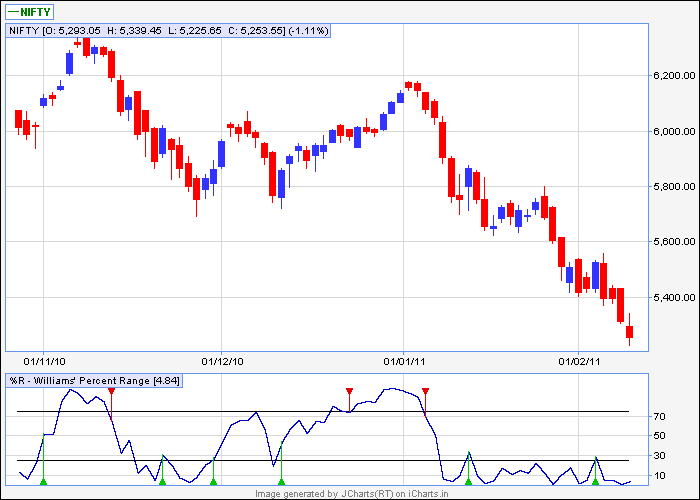
| Post: #14 Posted: Wed Feb 09, 2011 9:05 pm Post subject: |
|
|
Hi,
Is it a star in downtrend in nifty eod?? It appears at a long term support of 5250. Confirmation is still pending.
Lets c tomm n in days to come how it unfolds.
thanks n regards
ravee
| Description: |
|
| Filesize: |
9.53 KB |
| Viewed: |
6084 Time(s) |
|
|
|
| Back to top |
|
|
chetan83
Brown Belt
Joined: 19 Feb 2010
Posts: 2037
|
| Post: #15 Posted: Wed Feb 09, 2011 9:37 pm Post subject: |
|
|
| singh.ravee wrote: | Hi,
Is it a star in downtrend in nifty eod?? It appears at a long term support of 5250. Confirmation is still pending.
Lets c tomm n in days to come how it unfolds.
thanks n regards
ravee |
Hi Ravee,
For morning star the last candle shud be in green, but here it is Red. Also, it wud be better if candle stick trades shud be followed with some oscillators.
I am just watching,
Regards,
Chetan.
|
|
| Back to top |
|
|
|


