| View previous topic :: View next topic |
| Author |
casper bhai, where r u :-) |
prasadkonda
White Belt

Joined: 20 Dec 2008
Posts: 32
|
Post: #61  Posted: Sat Nov 05, 2011 8:41 am Post subject: Posted: Sat Nov 05, 2011 8:41 am Post subject: |
 |
|
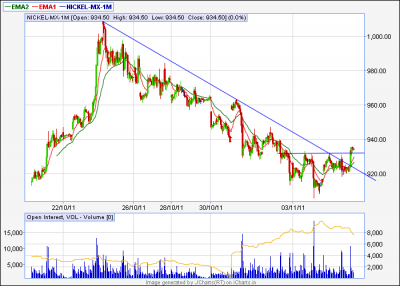
Casper sir! please check the attached chart and what could be the probable tgt
Regards
maruthi
| Description: |
|
| Filesize: |
26.42 KB |
| Viewed: |
615 Time(s) |

|
|
|
| Back to top |
|
 |
|
|
 |
casper
Green Belt

Joined: 02 Oct 2010
Posts: 1315
|
Post: #62  Posted: Sat Nov 05, 2011 8:59 am Post subject: Posted: Sat Nov 05, 2011 8:59 am Post subject: |
 |
|
| maneesh007 wrote: | bhai, posting two versions of same chart...please guide me which is more accurate... 
regards
Maneesh Bhardwaj |
.
nifty 5min latest two is perfect
as per the other chart, if u go down to 1tf, u might find accurate div in that case, it was not a 5 min div, (bcoz thr was hardly any noticeable high in rsi during 2nd top)
|
|
| Back to top |
|
 |
casper
Green Belt

Joined: 02 Oct 2010
Posts: 1315
|
Post: #63  Posted: Sat Nov 05, 2011 9:03 am Post subject: Posted: Sat Nov 05, 2011 9:03 am Post subject: |
 |
|
| maneesh007 wrote: | Casper Bhai,
Sorry I am keep on posting charts without knowing ur busy schedule...hope not disturbing u...brother please comment on this chart...
  
regards
Maneesh Bhardwaj |
it was a grade - div, but as u caught it on bullish phase, so this div did not produce major downfall and perhaps after taking support at 34 ema, became choppy
|
|
| Back to top |
|
 |
casper
Green Belt

Joined: 02 Oct 2010
Posts: 1315
|
Post: #64  Posted: Sat Nov 05, 2011 9:25 am Post subject: Posted: Sat Nov 05, 2011 9:25 am Post subject: |
 |
|
| prasadkonda wrote: | Casper sir! please check the attached chart and what could be the probable tgt
Regards
maruthi |
hi maruthi
when ever u post any chart, plz write the time frame u r posting,
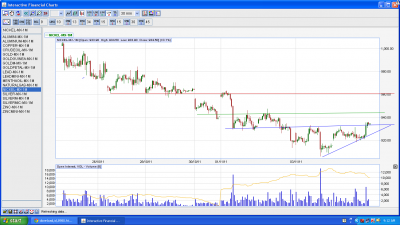
as i could not understand which tf u were referring, so i have drawn it in 30min tf
here in nickel, we can see an ascending triangle formation
which is already broken out and if it holds successfully then we can expect some 960 range in coming days
apart from that, plz notice that i have marked two levels with green and red, u can see that multiple tops or bottoms formed around these zones in past, so for any up move, these zones can provide resistance, this way, in any chart, wherever u find zones with multiple tops or bots, u can treat them as ur potential support or resi as applicable
| Description: |
|
| Filesize: |
90.87 KB |
| Viewed: |
588 Time(s) |

|
|
|
| Back to top |
|
 |
prasadkonda
White Belt

Joined: 20 Dec 2008
Posts: 32
|
Post: #65  Posted: Sat Nov 05, 2011 9:55 am Post subject: Posted: Sat Nov 05, 2011 9:55 am Post subject: |
 |
|
casper sir!
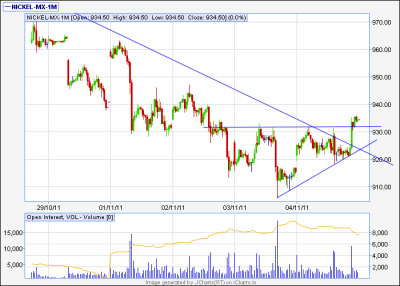
Thank you for your guidance and sorry for not mentioning the time frame. i have posted it 20 min time frame.
i got confusion that at the end of the chart it made reverse h&s or ascending triangles. please clear my doubt
Regards
maruthi
| Description: |
|
| Filesize: |
20.02 KB |
| Viewed: |
589 Time(s) |

|
|
|
| Back to top |
|
 |
maneesh007
White Belt

Joined: 08 Feb 2009
Posts: 119
|
Post: #66  Posted: Sat Nov 05, 2011 11:17 am Post subject: Posted: Sat Nov 05, 2011 11:17 am Post subject: |
 |
|
| casper wrote: | | maneesh007 wrote: | Casper Bhai,
Sorry I am keep on posting charts without knowing ur busy schedule...hope not disturbing u...brother please comment on this chart...
  
regards
Maneesh Bhardwaj |
it was a grade - div, but as u caught it on bullish phase, so this div did not produce major downfall and perhaps after taking support at 34 ema, became choppy |
Bhai, attached chart indicates the latest status of this div...ur valuable comments are awaited... 
Last edited by maneesh007 on Sat Nov 05, 2011 5:05 pm; edited 1 time in total |
|
| Back to top |
|
 |
maneesh007
White Belt

Joined: 08 Feb 2009
Posts: 119
|
Post: #67  Posted: Sat Nov 05, 2011 11:22 am Post subject: Posted: Sat Nov 05, 2011 11:22 am Post subject: |
 |
|
| casper wrote: | | maneesh007 wrote: | bhai, posting two versions of same chart...please guide me which is more accurate... 
regards
Maneesh Bhardwaj |
.
nifty 5min latest two is perfect
as per the other chart, if u go down to 1tf, u might find accurate div in that case, it was not a 5 min div, (bcoz thr was hardly any noticeable high in rsi during 2nd top) |
Point noted bhai... 
|
|
| Back to top |
|
 |
casper
Green Belt

Joined: 02 Oct 2010
Posts: 1315
|
Post: #68  Posted: Sat Nov 05, 2011 1:28 pm Post subject: Posted: Sat Nov 05, 2011 1:28 pm Post subject: |
 |
|
| maneesh007 wrote: |
Bhai, attached chart indicates the latest status of this div...ur valuable comments are awaited...  |
ya enough time of choppiness, now go down to smaller tfs and look for + div to reentry here with strict sl (long trades)
|
|
| Back to top |
|
 |
casper
Green Belt

Joined: 02 Oct 2010
Posts: 1315
|
|
| Back to top |
|
 |
prasadkonda
White Belt

Joined: 20 Dec 2008
Posts: 32
|
Post: #70  Posted: Sat Nov 05, 2011 3:58 pm Post subject: Posted: Sat Nov 05, 2011 3:58 pm Post subject: |
 |
|
Casper!!!!
 
Thank you
maruthi
|
|
| Back to top |
|
 |
maneesh007
White Belt

Joined: 08 Feb 2009
Posts: 119
|
Post: #71  Posted: Sun Nov 06, 2011 9:48 am Post subject: Posted: Sun Nov 06, 2011 9:48 am Post subject: |
 |
|
Casper bhai,
Please check your inbox...
regards
Maneesh Bhardwaj
|
|
| Back to top |
|
 |
maneesh007
White Belt

Joined: 08 Feb 2009
Posts: 119
|
Post: #72  Posted: Sun Nov 06, 2011 12:40 pm Post subject: Posted: Sun Nov 06, 2011 12:40 pm Post subject: |
 |
|
bhai, sorry , due to some technical issues...I have sent you 3 PMs...
  
|
|
| Back to top |
|
 |
casper
Green Belt

Joined: 02 Oct 2010
Posts: 1315
|
Post: #73  Posted: Sun Nov 06, 2011 12:55 pm Post subject: Posted: Sun Nov 06, 2011 12:55 pm Post subject: |
 |
|
| ya replied all, see ur inbox, but bottom line is, when u have a failure, wait for a much higher tf div to come
|
|
| Back to top |
|
 |
maneesh007
White Belt

Joined: 08 Feb 2009
Posts: 119
|
Post: #74  Posted: Sun Nov 06, 2011 1:17 pm Post subject: Posted: Sun Nov 06, 2011 1:17 pm Post subject: |
 |
|
| casper wrote: | | ya replied all, see ur inbox, but bottom line is, when u have a failure, wait for a much higher tf div to come |
Point noted bhai...plzz check again
|
|
| Back to top |
|
 |
maneesh007
White Belt

Joined: 08 Feb 2009
Posts: 119
|
Post: #75  Posted: Tue Nov 08, 2011 8:08 pm Post subject: Posted: Tue Nov 08, 2011 8:08 pm Post subject: |
 |
|
Dear casper bhai,
I intentionally did'nt spoil the charts...coz I want u to draw, plzz confirm any triangle pattern in these charts in different TFs...
  
warm regards
Maneesh Bhardwaj
| Description: |
|
| Filesize: |
61.51 KB |
| Viewed: |
579 Time(s) |

|
| Description: |
|
| Filesize: |
61.39 KB |
| Viewed: |
571 Time(s) |

|
| Description: |
|
| Filesize: |
54.15 KB |
| Viewed: |
567 Time(s) |

|
|
|
| Back to top |
|
 |
|

