|
|
| View previous topic :: View next topic |
| Author |
casper bhai, where r u :-) |
maneesh007
White Belt

Joined: 08 Feb 2009
Posts: 119
|
Post: #1  Posted: Tue Nov 01, 2011 11:44 am Post subject: casper bhai, where r u :-) Posted: Tue Nov 01, 2011 11:44 am Post subject: casper bhai, where r u :-) |
 |
|
HI casper bhai,
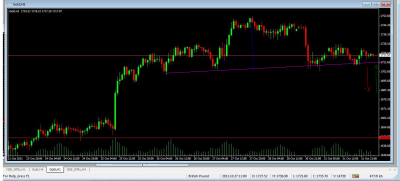
Please throw some light on this chart of Gold 1 hr (05 dec expiry)...
sorry bro chart is of international Gold, as I trade local  ...so mistakenly written as 05 dec expiry... ...so mistakenly written as 05 dec expiry... 
warm regards,
Maneesh bhardwaj
Last edited by maneesh007 on Sat Nov 05, 2011 5:12 pm; edited 2 times in total |
|
| Back to top |
|
 |
|
| |
casper
Green Belt

Joined: 02 Oct 2010
Posts: 1315
|
| Post: #2 Posted: Tue Nov 01, 2011 12:30 pm Post subject: |
|
|
hi maneesh bhai
plz give me some time, i hv no chart with me at this moment
|
|
| Back to top |
|
|
maneesh007
White Belt
Joined: 08 Feb 2009
Posts: 119
|
| Post: #3 Posted: Tue Nov 01, 2011 12:40 pm Post subject: |
|
|
ok bhai, time given  ...take your time bhai, but before any considerable move...thnk u & god bless u... ...take your time bhai, but before any considerable move...thnk u & god bless u...
|
|
| Back to top |
|
|
casper
Green Belt
Joined: 02 Oct 2010
Posts: 1315
|
| Post: #4 Posted: Tue Nov 01, 2011 1:17 pm Post subject: |
|
|
ok maneesh bhai seen
u r using international market chart which runs 24 hrs and i was foolishly trying to compare it with 13 hrs mcx charts
so naturally, my chart got lots of gaps which in ur chart got filled wid candles
so lets work with ur chart as its more appropriate,
needless to say that the pattern is a head and shoulder, an apparently bearish formation
the pink line i hv drawn is the neck line which should be broken down around 1711.85 range
the blue line on the top is the possible target which is projected downward as another red line as possible target projection
if this goes as per plan, then below 1711 it would go down for 41 points
(or 41 $ i assume)
now the point is
my exp wid h/s says its a nasty pattern, some time it gives full target and even more, spelling doom for bulls and at times, it becomes a bear trap, so during break down, check for + div in lower tfs, if any div comes then dont short, if there is no div around, then only open the short.
even so, after breaking down successfully, going down through red line and after finding some support, getting up with the green line is not very rare
in that case, after breaking down, and falling a bit, it will again show u some divergence in lower tfs , like 5-10 min tf and will go up
so u need to be very careful for spotting this div during fall and if u can successfully spot this div then u can get a long trade from there, for that long trade, latest low should be ur sl and neck line (pink one) will be ur possible target
and if it touches neck line from lower side, along with the green arrow marked path, book ur long and wait for a rejection.... a red candle just below the neck line to open another short
so potentially, this pattern can give u 3 trading opportunity, short-long-short
| Description: |
|
| Filesize: |
384.44 KB |
| Viewed: |
630 Time(s) |
|
|
|
| Back to top |
|
|
maneesh007
White Belt
Joined: 08 Feb 2009
Posts: 119
|
| Post: #5 Posted: Tue Nov 01, 2011 2:31 pm Post subject: |
|
|
ok bhai , verified & completely understood...Now let's play the game  ...& thnk u sooooooooooo much ...& thnk u sooooooooooo much
reagrds
maneesh bhardwaj
|
|
| Back to top |
|
|
maneesh007
White Belt
Joined: 08 Feb 2009
Posts: 119
|
| Post: #6 Posted: Wed Nov 02, 2011 9:45 am Post subject: |
|
|
casper bhai,
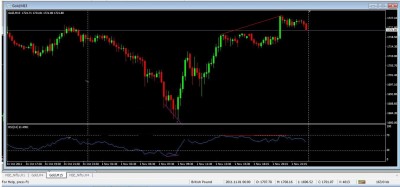
charts is of International Gold 15 mins... plz validate this div...
regards
Maneesh bhardwaj
Last edited by maneesh007 on Sat Nov 05, 2011 5:13 pm; edited 1 time in total |
|
| Back to top |
|
|
casper
Green Belt
Joined: 02 Oct 2010
Posts: 1315
|
| Post: #7 Posted: Wed Nov 02, 2011 9:56 am Post subject: |
|
|
join top of price to top of rsi
or bottom of price to bottom of indicator
pink one was + div and red one is - div
now red one has much more candle than 14
so check in higher tfs to find the - div in these also
(like 30/60min)
| Description: |
|
| Filesize: |
100.57 KB |
| Viewed: |
634 Time(s) |
|
|
|
| Back to top |
|
|
maneesh007
White Belt
Joined: 08 Feb 2009
Posts: 119
|
| Post: #8 Posted: Wed Nov 02, 2011 10:14 am Post subject: |
|
|
Brother,Sorry for distrubing u again & again...plz check this chart of Gold 30 min , I think we would'nt call it div ...plzz comment
Last edited by maneesh007 on Sat Nov 05, 2011 5:14 pm; edited 1 time in total |
|
| Back to top |
|
|
casper
Green Belt
Joined: 02 Oct 2010
Posts: 1315
|
| Post: #9 Posted: Wed Nov 02, 2011 10:22 am Post subject: |
|
|
no
its not div in 30 min, since 15 min chart has more gaps and in 30 min, its not a div, that means it was a weak case, may be 34 ema in ur 15tf chart cud be the downside target
and its not actually disturbing any way, all of urs posts give me an opportunity to practice more
|
|
| Back to top |
|
|
maneesh007
White Belt
Joined: 08 Feb 2009
Posts: 119
|
| Post: #10 Posted: Wed Nov 02, 2011 10:38 am Post subject: |
|
|
thanks casper bhai... believe me, you are really a rare combo ...
sorry i copied ur trademark pattern of smileys...
warm regards
Maneesh bhardwaj
|
|
| Back to top |
|
|
maneesh007
White Belt
Joined: 08 Feb 2009
Posts: 119
|
| Post: #11 Posted: Wed Nov 02, 2011 3:16 pm Post subject: |
|
|
Hi casper bhai,
Sorry to bother u again...bhai plz validate this formation...
Last edited by maneesh007 on Wed Nov 02, 2011 4:31 pm; edited 1 time in total |
|
| Back to top |
|
|
maneesh007
White Belt
Joined: 08 Feb 2009
Posts: 119
|
| Post: #12 Posted: Wed Nov 02, 2011 3:37 pm Post subject: |
|
|
I got my answer...sorry brother +14 factor 
|
|
| Back to top |
|
|
casper
Green Belt
Joined: 02 Oct 2010
Posts: 1315
|
| Post: #13 Posted: Wed Nov 02, 2011 3:42 pm Post subject: |
|
|
this is a - div, but distance between two tops are more than 14 candles, so as rule we need to check it immediate higher time frame to see if there is also div is present or not
suppose next tf is 20min, u saw there is a div but distance is still more than 14. then go ahead one more step and check immediate higher tf for div
for a comparatively secured trade, we need the distance between two tops (or for a +div, two bottoms) to be within 14candles (as we r using rsi 14), and then keep sl on the 2nd top, with some cushion
suppose 2nd top is at rs10, u keep sl at 10.50 or 11 max
|
|
| Back to top |
|
|
casper
Green Belt
Joined: 02 Oct 2010
Posts: 1315
|
| Post: #14 Posted: Wed Nov 02, 2011 3:43 pm Post subject: |
|
|
| maneesh007 wrote: | | I got my answer...sorry brother +14 factor |
ya
u learnt it

|
|
| Back to top |
|
|
maneesh007
White Belt
Joined: 08 Feb 2009
Posts: 119
|
| Post: #15 Posted: Wed Nov 02, 2011 3:50 pm Post subject: |
|
|
| casper wrote: | this is a - div, but distance between two tops are more than 14 candles, so as rule we need to check it immediate higher time frame to see if there is also div is present or not
suppose next tf is 20min, u saw there is a div but distance is still more than 14. then go ahead one more step and check immediate higher tf for div
for a comparatively secured trade, we need the distance between two tops (or for a +div, two bottoms) to be within 14candles (as we r using rsi 14), and then keep sl on the 2nd top, with some cushion
suppose 2nd top is at rs10, u keep sl at 10.50 or 11 max
|
bhai, thanks for diverting some +ive energy towards me...
|
|
| Back to top |
|
|
|
|
You cannot post new topics in this forum
You cannot reply to topics in this forum
You cannot edit your posts in this forum
You cannot delete your posts in this forum
You cannot vote in polls in this forum
You can attach files in this forum
You can download files in this forum
|
Powered by phpBB © 2001, 2005 phpBB Group
|
|
|


