| View previous topic :: View next topic |
| Author |
CHARTS & PATTERNS |
jdpt
Yellow Belt

Joined: 25 Jun 2012
Posts: 806
|
Post: #121  Posted: Wed Aug 01, 2012 9:04 am Post subject: Posted: Wed Aug 01, 2012 9:04 am Post subject: |
 |
|
| no probs. dear, ravi you talking about which one ?
|
|
| Back to top |
|
 |
|
|
 |
jdpt
Yellow Belt

Joined: 25 Jun 2012
Posts: 806
|
|
| Back to top |
|
 |
jdpt
Yellow Belt

Joined: 25 Jun 2012
Posts: 806
|
|
| Back to top |
|
 |
jdpt
Yellow Belt

Joined: 25 Jun 2012
Posts: 806
|
|
| Back to top |
|
 |
ravionlinek
White Belt

Joined: 11 Jun 2010
Posts: 97
|
Post: #125  Posted: Wed Aug 01, 2012 6:24 pm Post subject: Posted: Wed Aug 01, 2012 6:24 pm Post subject: |
 |
|
| jdpt wrote: | | no probs. dear, ravi you talking about which one ? |
......................................................................................................
its Head and Shoulder pattern in GbpYen
Last edited by ravionlinek on Wed Aug 01, 2012 6:38 pm; edited 1 time in total |
|
| Back to top |
|
 |
ravionlinek
White Belt

Joined: 11 Jun 2010
Posts: 97
|
Post: #126  Posted: Wed Aug 01, 2012 6:33 pm Post subject: Replay To NSE chart Posted: Wed Aug 01, 2012 6:33 pm Post subject: Replay To NSE chart |
 |
|
| and ur NSE chart suggesting Rising Wedge uptrend
|
|
| Back to top |
|
 |
jdpt
Yellow Belt

Joined: 25 Jun 2012
Posts: 806
|
Post: #127  Posted: Thu Aug 02, 2012 12:33 am Post subject: Posted: Thu Aug 02, 2012 12:33 am Post subject: |
 |
|
| Dear ravi, in gbpyen yes there was a h&s too but i was talking about that 2nd last small green bar where i marked entry, that bar is also known as a bullish hammer. Now about nf's snaps, when i croped it and was going to save it instead of type imgs name i think by mistake i replaced with any previous snap's name, anyway thanks alot for your feedbacks and correcting me for nf's snaps.
|
|
| Back to top |
|
 |
ravionlinek
White Belt

Joined: 11 Jun 2010
Posts: 97
|
Post: #128  Posted: Thu Aug 02, 2012 12:53 am Post subject: Posted: Thu Aug 02, 2012 12:53 am Post subject: |
 |
|
| jdpt wrote: | | Dear ravi, in gbpyen yes there was a h&s too but i was talking about that 2nd last small green bar where i marked entry, that bar is also known as a bullish hammer. Now about nf's snaps, when i croped it and was going to save it instead of type imgs name i think by mistake i replaced with any previous snap's name, anyway thanks alot for your feedbacks and correcting me for nf's snaps. |
..................................................................................................
its small mistake its happen with me also some time.
|
|
| Back to top |
|
 |
jdpt
Yellow Belt

Joined: 25 Jun 2012
Posts: 806
|
|
| Back to top |
|
 |
jdpt
Yellow Belt

Joined: 25 Jun 2012
Posts: 806
|
|
| Back to top |
|
 |
jdpt
Yellow Belt

Joined: 25 Jun 2012
Posts: 806
|
|
| Back to top |
|
 |
amitvjog
White Belt

Joined: 21 Mar 2011
Posts: 80
|
Post: #132  Posted: Thu Aug 09, 2012 12:25 pm Post subject: Nifty Spot - 09-Aug-2012 Posted: Thu Aug 09, 2012 12:25 pm Post subject: Nifty Spot - 09-Aug-2012 |
 |
|
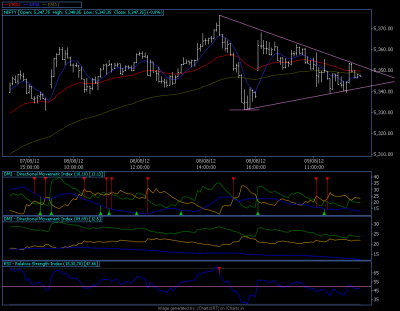
Nifty on the verge of breakout
| Description: |
| Nifty on the verge of breakout |
|
| Filesize: |
47.23 KB |
| Viewed: |
467 Time(s) |

|
|
|
| Back to top |
|
 |
shekharinvest
Yellow Belt

Joined: 21 Dec 2007
Posts: 549
|
Post: #133  Posted: Sun Aug 12, 2012 1:50 pm Post subject: Posted: Sun Aug 12, 2012 1:50 pm Post subject: |
 |
|
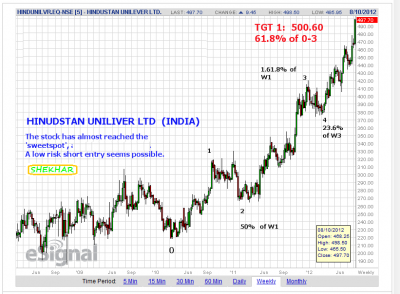
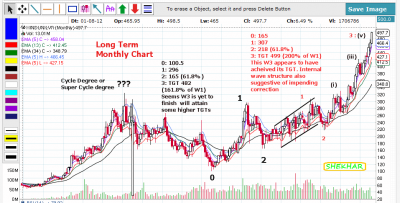
The charts are self explanatory.
Also on daily chart Wolves Wave formation is visible (chart not posted). One can initiate shorts once the price breaches the upper trend line. TGT as per WW 440 approx. and 38% retracement of W3 (red) comes closer to 391.
It is time to keep a close watch on the scrip to initiate shorts.
Weekly charts here shows the internal wave structure of W3 in red colour which starts at 218.
Happy trading !
SHEKHAR
NB: A small request to ST/PT if possible. As JDPT has started his own thread. If you could move JDPT's posts to his thread.
It will be a bit convenient here to look back to my previous charts and continue my monologue. 
| Description: |
|
| Filesize: |
50.74 KB |
| Viewed: |
476 Time(s) |

|
| Description: |
|
| Filesize: |
90.14 KB |
| Viewed: |
467 Time(s) |

|
|
|
| Back to top |
|
 |
p_wangdu
White Belt

Joined: 30 Apr 2012
Posts: 126
|
Post: #134  Posted: Sun Aug 12, 2012 6:27 pm Post subject: thanks for the chart Posted: Sun Aug 12, 2012 6:27 pm Post subject: thanks for the chart |
 |
|
 shekhar thank you very much for the chart., yes i do agree that time being HUL may make top around 507 to come down round 474 and keep its upward journey till 530 .. i will be bearish on it if breach 460. onceagain thank you very muck. shekhar thank you very much for the chart., yes i do agree that time being HUL may make top around 507 to come down round 474 and keep its upward journey till 530 .. i will be bearish on it if breach 460. onceagain thank you very muck.
|
|
| Back to top |
|
 |
jdpt
Yellow Belt

Joined: 25 Jun 2012
Posts: 806
|
Post: #135  Posted: Mon Aug 13, 2012 11:31 pm Post subject: Posted: Mon Aug 13, 2012 11:31 pm Post subject: |
 |
|
| shekharinvest wrote: | The charts are self explanatory.
Also on daily chart Wolves Wave formation is visible (chart not posted). One can initiate shorts once the price breaches the upper trend line. TGT as per WW 440 approx. and 38% retracement of W3 (red) comes closer to 391.
It is time to keep a close watch on the scrip to initiate shorts.
Weekly charts here shows the internal wave structure of W3 in red colour which starts at 218.
Happy trading !
SHEKHAR
NB: A small request to ST/PT if possible. As JDPT has started his own thread. If you could move JDPT's posts to his thread.
It will be a bit convenient here to look back to my previous charts and continue my monologue.  |
Respected Shekhar sir, behind opening my one there was no bad intention to create such an awkward and embarrassing situation for you/your thread, Please accept my deepest apologies to make such inconvenience to you, Sir as i'm not much familier with icharts functions so can you/icharts(support team)/anyone please tell me how do i kill my older posts form this thread ?
Regards
JDPT
|
|
| Back to top |
|
 |
|

