| View previous topic :: View next topic |
| Author |
CHARTS & PATTERNS |
shekharinvest
Yellow Belt

Joined: 21 Dec 2007
Posts: 549
|
Post: #136  Posted: Tue Aug 14, 2012 5:39 am Post subject: Posted: Tue Aug 14, 2012 5:39 am Post subject: |
 |
|
JDPT,
This is an open forum.
There is no reason for you to apologise. Note was never meant to be a dis-approval of your posts. It was only for the convenience sake as we both have different styles of posting. 
SHEKHAR
|
|
| Back to top |
|
 |
|
|
 |
rk_a2003
Black Belt

Joined: 21 Jan 2010
Posts: 2734
|
Post: #137  Posted: Tue Aug 14, 2012 6:55 am Post subject: Posted: Tue Aug 14, 2012 6:55 am Post subject: |
 |
|
Shekhar,
Three cheers for your HINDUNILVR analysis .You are right on target. You said it’s a low risk Short. I read and wondered. It went down as if obeying your ‘orders’ to go down  . .
I know your analysis is based on Elliot Wave theory. I am not much aware of Elliot wave. It’s your thread which ignited interest of ww in me and pushed me out of losses(In to profits too). May be you are now igniting another one. Thanks A Lot
When you posted your Hindunilvr chart I also studied ITC and thought that The chance of ITC going down is better for the reason Hinduni closed at day high and ITC made an inverse hammer like formation with topping tail. I also observed a –ww in ITC weekly chart.
At the end of the day my assumption went wrong. Now I realized Elliot wave analysis have something more.
I would love to hear your analysis on ITC( if any )and if your time permits.
|
|
| Back to top |
|
 |
psalm
Black Belt

Joined: 12 Nov 2011
Posts: 5368
|
Post: #138  Posted: Tue Aug 14, 2012 8:00 am Post subject: Posted: Tue Aug 14, 2012 8:00 am Post subject: |
 |
|
| rk_a2003 wrote: | Shekhar,
Three cheers for your HINDUNILVR analysis .You are right on target. You said it’s a low risk Short. I read and wondered. It went down as if obeying your ‘orders’ to go down  . .
I know your analysis is based on Elliot Wave theory. I am not much aware of Elliot wave. It’s your thread which ignited interest of ww in me and pushed me out of losses(In to profits too). May be you are now igniting another one. Thanks A Lot
When you posted your Hindunilvr chart I also studied ITC and thought that The chance of ITC going down is better for the reason Hinduni closed at day high and ITC made an inverse hammer like formation with topping tail. I also observed a –ww in ITC weekly chart.
At the end of the day my assumption went wrong. Now I realized Elliot wave analysis have something more.
I would love to hear your analysis on ITC( if any )and if your time permits. |
Yes...Hindustan UniLever analysis was pure excellence.....Hats off...... 
|
|
| Back to top |
|
 |
shekharinvest
Yellow Belt

Joined: 21 Dec 2007
Posts: 549
|
Post: #139  Posted: Wed Dec 12, 2012 9:02 am Post subject: Posted: Wed Dec 12, 2012 9:02 am Post subject: |
 |
|
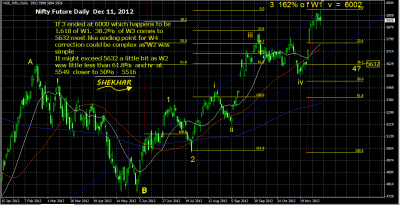
It seems Nifty has made a short term top here. Price move in next day or two should confirm.
Complex and time consuming W4 is to be expected for the next couple of weeks (months).
Chart is self explanatory and in continuation to my previous July 13, post. Tgts have been tweaked as per the internal wave structures.
Happy Trading !
SHEKHAR
| Description: |
|
| Filesize: |
70.53 KB |
| Viewed: |
483 Time(s) |

|
Last edited by shekharinvest on Wed Dec 12, 2012 9:11 am; edited 1 time in total |
|
| Back to top |
|
 |
skd2012
Yellow Belt

Joined: 03 Oct 2012
Posts: 948
|
Post: #140  Posted: Wed Dec 12, 2012 9:08 am Post subject: Posted: Wed Dec 12, 2012 9:08 am Post subject: |
 |
|
"Price move in next day or two should confirm" this is very important part I feel.
Just to point out one thing, we just made a new swing high yesterday, but yesterday;s fall emotionally making us think that it is done. But with momentum it can go anywhere in upside and chances are more that it can make more new high. Just my thought!! 
|
|
| Back to top |
|
 |
saumya12
Brown Belt

Joined: 21 Dec 2011
Posts: 1509
|
Post: #141  Posted: Wed Dec 12, 2012 11:35 am Post subject: Posted: Wed Dec 12, 2012 11:35 am Post subject: |
 |
|
Thanks
But how to be sure that W3 has completed.
|
|
| Back to top |
|
 |
vinst
Black Belt

Joined: 09 Jan 2007
Posts: 3303
|
Post: #142  Posted: Wed Dec 12, 2012 11:41 am Post subject: Posted: Wed Dec 12, 2012 11:41 am Post subject: |
 |
|
| saumya12 wrote: | Thanks
But how to be sure that W3 has completed. |
only when W5 gets completed ! (just joking, I know very little about this type of wave analysis)
|
|
| Back to top |
|
 |
shekharinvest
Yellow Belt

Joined: 21 Dec 2007
Posts: 549
|
Post: #143  Posted: Wed Dec 12, 2012 5:47 pm Post subject: Posted: Wed Dec 12, 2012 5:47 pm Post subject: |
 |
|
| saumya12 wrote: | Thanks
But how to be sure that W3 has completed. |
There is no way to know for sure! As Vinst said only after the completion of the wave we can label them.
It is just an attempt to find a low risk entry for a trade, by applying the wave principles.
Trading is the objective, not the analysis. 
SHEKHAR
|
|
| Back to top |
|
 |
shekharinvest
Yellow Belt

Joined: 21 Dec 2007
Posts: 549
|
Post: #144  Posted: Thu Jan 17, 2013 8:06 pm Post subject: Posted: Thu Jan 17, 2013 8:06 pm Post subject: |
 |
|
Bharti Artl
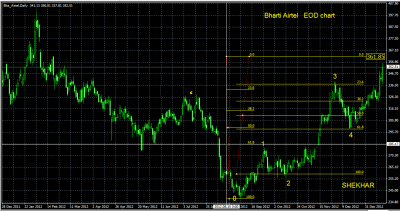
For Positional Longs wait for correction.
This is an EOD chart for Bharti ARTL, which clearly shows a five wave move past the reflex point is about to end. The estimated end point for wave 5 comes to 360.85, and we can now look for 3 wave correction before we initiate positional Longs. Supposing it ends at given tgt we can expect 50% to 61.8% retracement i.e. look to buy in the range of 300 - 285.
Here is a Short Trade for short term
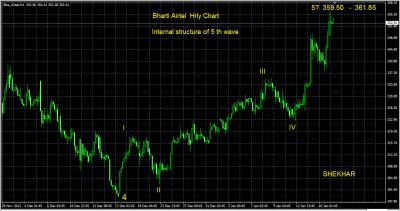
Here is a Hrly chart depicting the internal wave structure of the wave 5
w ii is almost 78% of w i
w iii is 161.8% of w i
w iv is 38.2% of w 3
A normal wave should have ended at 345 approx. Here w v has started expanding and the possible TGT could be 359.5 at 100% from there we can expect fast retracement into the range of 329 -326.
If we go deeper into the sub wave and take the emerging ratios likely projected end is close to 361. Hence from the above three we can safely assume that there is a very good chance for a low risk short entry close to 360 with minimum stoploss and tgt could be 329-326 and then may be 300-285
Keep in mind wave 5's can keep expanding, we only know after the end of it.
Happy Trading !
SHEKHAR
| Description: |
|
| Filesize: |
26.46 KB |
| Viewed: |
377 Time(s) |

|
| Description: |
|
| Filesize: |
30.86 KB |
| Viewed: |
402 Time(s) |

|
|
|
| Back to top |
|
 |
shekharinvest
Yellow Belt

Joined: 21 Dec 2007
Posts: 549
|
|
| Back to top |
|
 |
skd2012
Yellow Belt

Joined: 03 Oct 2012
Posts: 948
|
Post: #146  Posted: Sun Mar 03, 2013 1:55 pm Post subject: Posted: Sun Mar 03, 2013 1:55 pm Post subject: |
 |
|
thanks for HCL TECH analysis.
please share some shares, which are in wave 4 and on the edge of starting wave 5.
thx!!
|
|
| Back to top |
|
 |
vinst
Black Belt

Joined: 09 Jan 2007
Posts: 3303
|
Post: #147  Posted: Sun Mar 03, 2013 7:23 pm Post subject: Posted: Sun Mar 03, 2013 7:23 pm Post subject: |
 |
|
| shekharinvest wrote: | Bharti Artl
For Positional Longs wait for correction.
This is an EOD chart for Bharti ARTL, which clearly shows a five wave move past the reflex point is about to end. The estimated end point for wave 5 comes to 360.85, and we can now look for 3 wave correction before we initiate positional Longs. Supposing it ends at given tgt we can expect 50% to 61.8% retracement i.e. look to buy in the range of 300 - 285.
Here is a Short Trade for short term
Here is a Hrly chart depicting the internal wave structure of the wave 5
w ii is almost 78% of w i
w iii is 161.8% of w i
w iv is 38.2% of w 3
A normal wave should have ended at 345 approx. Here w v has started expanding and the possible TGT could be 359.5 at 100% from there we can expect fast retracement into the range of 329 -326.
If we go deeper into the sub wave and take the emerging ratios likely projected end is close to 361. Hence from the above three we can safely assume that there is a very good chance for a low risk short entry close to 360 with minimum stoploss and tgt could be 329-326 and then may be 300-285
Keep in mind wave 5's can keep expanding, we only know after the end of it.
Happy Trading !
SHEKHAR |
Hi Shekhar,
Bharti came to 300-285 !!
Good analysis.
regards,
|
|
| Back to top |
|
 |
ragarwal
Yellow Belt

Joined: 16 Nov 2008
Posts: 582
|
Post: #148  Posted: Sun Mar 03, 2013 7:37 pm Post subject: Posted: Sun Mar 03, 2013 7:37 pm Post subject: |
 |
|
| hello shekhar,wats the call in bharti now.cn i buy it now?if yes then wat shud be the target
|
|
| Back to top |
|
 |
shekharinvest
Yellow Belt

Joined: 21 Dec 2007
Posts: 549
|
Post: #149  Posted: Mon Mar 04, 2013 9:53 am Post subject: Posted: Mon Mar 04, 2013 9:53 am Post subject: |
 |
|
| ragarwal wrote: | | hello shekhar,wats the call in bharti now.cn i buy it now?if yes then wat shud be the target |
Bharti Artl
To be frank I am pretty clueless right now, reason being I fail to see a three wave move down lets us wait for some more time and see if we can label the down wave move as ABC.
The present move to 291 seems to be a five wave down hence I anticipate an upmove before a final down move as in wave C making it a zig-zag correction i.e. 5-3-5
But the move in anticipated wave B has confused me because it has moved up like a wave 3 (sharp move) unlike wave B. Hence, wait and watch.
SHEKHAR
|
|
| Back to top |
|
 |
ragarwal
Yellow Belt

Joined: 16 Nov 2008
Posts: 582
|
Post: #150  Posted: Mon Mar 04, 2013 3:10 pm Post subject: Posted: Mon Mar 04, 2013 3:10 pm Post subject: |
 |
|
thnx shekhar 
|
|
| Back to top |
|
 |
|

