| View previous topic :: View next topic |
| Author |
CHARTS & PATTERNS |
shekharinvest
Yellow Belt

Joined: 21 Dec 2007
Posts: 549
|
Post: #151  Posted: Thu Apr 04, 2013 1:33 pm Post subject: Posted: Thu Apr 04, 2013 1:33 pm Post subject: |
 |
|
Bharti is approaching Buy Zone
Buy between Rs 267 - 256 with SL below 237.
Below 237.9 this whole count gets invalidated.
SHEKHAR
PS: My values are based on GCI charts hence may vary from actuals as you all know.
|
|
| Back to top |
|
 |
|
|
 |
shekharinvest
Yellow Belt

Joined: 21 Dec 2007
Posts: 549
|
Post: #152  Posted: Sat May 04, 2013 5:17 pm Post subject: Posted: Sat May 04, 2013 5:17 pm Post subject: |
 |
|
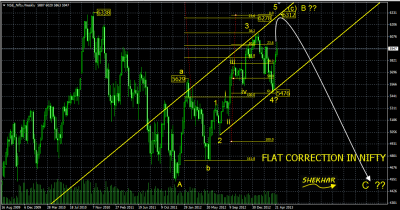
I had posted a count on Nifty in July 12 and next in Dec 12, I feel that bearish count is still valid and nothing has changed since.
The downmove which started from 6115 in the end of Jan 2013 and reached the low of 5476 has negated any bullish count starting from the low 4534 in oct 2011, we can't label it as impulsive wave, because of the overlap, unless of course the 3rd wave itself is subdividing and we are witnessing the 3rd of 3rd which implies super bullish trend.
For now, I am still taking this upmove as 'abc' of wave B starting from the low of 4534, hence, 138.2% of wave 'a' comes to 6278 and golden ratio target for internal wave 5 of wave 'c' comes to 6312 , which also happens to be a channel TGT. 6278-6312 zone should be the end point of this upmove, the whole correction ABC for the move startng from the low of Oct 2008 may turnout to be a Flat Correction, ending somewhere close to previous low of 4534
SHEKHAR 
Happy Trading!
| Description: |
|
| Filesize: |
52.91 KB |
| Viewed: |
502 Time(s) |

|
|
|
| Back to top |
|
 |
apka
Black Belt

Joined: 13 Dec 2011
Posts: 6137
|
Post: #153  Posted: Sat May 04, 2013 6:05 pm Post subject: Posted: Sat May 04, 2013 6:05 pm Post subject: |
 |
|
scary chart and a bomb msg at the end happy trading 
|
|
| Back to top |
|
 |
vinay28
Black Belt

Joined: 24 Dec 2010
Posts: 11748
|
Post: #154  Posted: Sat May 04, 2013 7:25 pm Post subject: Posted: Sat May 04, 2013 7:25 pm Post subject: |
 |
|
| That's similar to the 13 month bear cycle predicted by vivek patil, a foremost neo wave specialist and about which I had commented about a few weeks ago. However, according to him, if I remember right, crossing over 6110 may negate that. Let's go step by step.
|
|
| Back to top |
|
 |
ragarwal
Yellow Belt

Joined: 16 Nov 2008
Posts: 582
|
Post: #155  Posted: Tue May 07, 2013 1:07 pm Post subject: Posted: Tue May 07, 2013 1:07 pm Post subject: |
 |
|
hello shekhar sir,
can u plz guide me in tata steel as to a possible entry point.i want to be an investor fr 2-3 yrs.
regds rashmi
|
|
| Back to top |
|
 |
vinay28
Black Belt

Joined: 24 Dec 2010
Posts: 11748
|
Post: #156  Posted: Tue May 07, 2013 1:15 pm Post subject: Posted: Tue May 07, 2013 1:15 pm Post subject: |
 |
|
| vinay28 wrote: | | That's similar to the 13 month bear cycle predicted by vivek patil, a foremost neo wave specialist and about which I had commented about a few weeks ago. However, according to him, if I remember right, crossing over 6110 may negate that. Let's go step by step. |
The latest blog by vivek patil states that his prediction is negated only above 6340.
|
|
| Back to top |
|
 |
shekharinvest
Yellow Belt

Joined: 21 Dec 2007
Posts: 549
|
Post: #157  Posted: Fri Jun 21, 2013 8:07 pm Post subject: Posted: Fri Jun 21, 2013 8:07 pm Post subject: |
 |
|
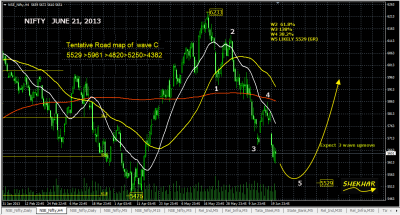
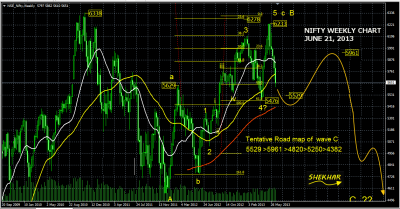
It appears that Nifty has completed c of wave B at 6233 and down trend has started we get a confirmation below 5476.
This down trend starting from 6233 will be in 5 waves.
This first set of 5 wave (forming wave 1 of C) is likely to end at 5529 as per golden ratio, if we go down further into the internals of wave 5 it suggest end point closer to 5555. So for now I anticipate fall to stop in the range of 5555-5529
There is an outside chance of taking out the previous low of 5476 as wave three was little less than normal- wave 5 could extend, to confirm the downtrend.
For now wait for a 3 wave up-move to initiate fresh shorts for big gains.
Happy Trading !
SHEKHAR 
| Description: |
|
| Filesize: |
58.57 KB |
| Viewed: |
508 Time(s) |

|
| Description: |
|
| Filesize: |
63.83 KB |
| Viewed: |
472 Time(s) |

|
|
|
| Back to top |
|
 |
shekharinvest
Yellow Belt

Joined: 21 Dec 2007
Posts: 549
|
|
| Back to top |
|
 |
riteshucha
Green Belt

Joined: 19 May 2012
Posts: 1292
|
Post: #159  Posted: Fri Jul 19, 2013 9:51 am Post subject: Posted: Fri Jul 19, 2013 9:51 am Post subject: |
 |
|
thanks shekhar for the link...
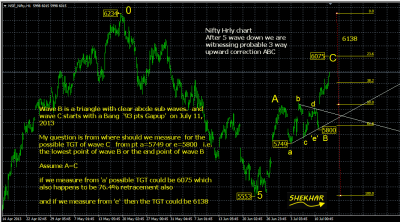
| shekharinvest wrote: | As of now it seems Tgt for Nifty could be 6079. Chart is self explanotary.
SHEKHAR  |
|
|
| Back to top |
|
 |
riteshucha
Green Belt

Joined: 19 May 2012
Posts: 1292
|
Post: #160  Posted: Fri Jul 19, 2013 12:15 pm Post subject: Posted: Fri Jul 19, 2013 12:15 pm Post subject: |
 |
|
hello shekhar.. i had read it one of previous posts.. when nifty started upward movement from 5570 or thereabt levels, that i might go up to arnd 5941.. and further should continue downwards journey for 5500 levels..
as per this current chart 6079 has almost reached...
i want to know, u hold the belief that breaking / closing above 6080 would negate your previous findings of sub 5500.. atleast in the near term.. or it is just an extension from 5940 levels...
ritesh
|
|
| Back to top |
|
 |
shekharinvest
Yellow Belt

Joined: 21 Dec 2007
Posts: 549
|
Post: #161  Posted: Fri Jul 19, 2013 2:38 pm Post subject: Posted: Fri Jul 19, 2013 2:38 pm Post subject: |
 |
|
riteshucha,
What I had outlined then was a broad idea, the shape Nifty movement can take, as per data available at that point of time.
W2 (0-5 was wave 1 of higher degree) generally retrace 62% hence the 5942 was suggested which was later changed. Price moving above 6234 will negate the count.
On July 13, I had posted on Ramki's blog the following chart along with my predicament. Here is his answer
RAMKI: Good question and nicely illustrated which other readers can benefit from. I would compute the C wave from the ending point of the triangle, which is point ‘e’. That happens to be the end of the B wave in a triangular formation. Classical analysts would measure the widest height of the triangle and add it to the breakout point on the upper line. You could use that as an added confirmation if your targets are corresponding. Good luck.
As Ramki says Elliotwave is a work in progress, hence we need to update /change / modify.
Keep Counting !
SHEKHAR
| Description: |
|
| Filesize: |
73.19 KB |
| Viewed: |
510 Time(s) |

|
|
|
| Back to top |
|
 |
riteshucha
Green Belt

Joined: 19 May 2012
Posts: 1292
|
Post: #162  Posted: Fri Jul 19, 2013 3:04 pm Post subject: Posted: Fri Jul 19, 2013 3:04 pm Post subject: |
 |
|
many thanks shekhar...
btw ritesh would be just fine.. 
| shekharinvest wrote: | riteshucha,
What I had outlined then was a broad idea, the shape Nifty movement can take, as per data available at that point of time.
W2 (0-5 was wave 1 of higher degree) generally retrace 62% hence the 5942 was suggested which was later changed. Price moving above 6234 will negate the count.
On July 13, I had posted on Ramki's blog the following chart along with my predicament. Here is his answer
RAMKI: Good question and nicely illustrated which other readers can benefit from. I would compute the C wave from the ending point of the triangle, which is point ‘e’. That happens to be the end of the B wave in a triangular formation. Classical analysts would measure the widest height of the triangle and add it to the breakout point on the upper line. You could use that as an added confirmation if your targets are corresponding. Good luck.
As Ramki says Elliotwave is a work in progress, hence we need to update /change / modify.
Keep Counting !
SHEKHAR |
|
|
| Back to top |
|
 |
saumya12
Brown Belt

Joined: 21 Dec 2011
Posts: 1509
|
Post: #163  Posted: Sat Jul 20, 2013 1:44 pm Post subject: Posted: Sat Jul 20, 2013 1:44 pm Post subject: |
 |
|
Many thanks to you r******, sorry, I mean Shekhar 
Please keep posting the chart on regular intervals say 15 days or so or when a new wave starts forming, so that we, the readers and followers of this thread, will be benefited and will learn the formation of elliott waves and rectify our mistake/error.
Thanks
|
|
| Back to top |
|
 |
vinay28
Black Belt

Joined: 24 Dec 2010
Posts: 11748
|
Post: #164  Posted: Sat Jul 20, 2013 4:27 pm Post subject: Posted: Sat Jul 20, 2013 4:27 pm Post subject: |
 |
|
| is this based on neowave?
|
|
| Back to top |
|
 |
sonshu101
White Belt

Joined: 24 Nov 2011
Posts: 79
|
Post: #165  Posted: Sat Jul 20, 2013 8:41 pm Post subject: Re: NIFTY 2 YEAR WAVE COUNT. Posted: Sat Jul 20, 2013 8:41 pm Post subject: Re: NIFTY 2 YEAR WAVE COUNT. |
 |
|
| vimalmehta wrote: | This is how i view the nifty count currently. A cycle wave triple zigzag in the making. I would have thought that a double zigzag at the November 2010 top would be sufficient for Cycle wave B, But the subsequent market correction for 9 months has been a clear ABC with wave B as a triangle. Lot of Bad news and bearish sentiment overall right now, i can't see the market going down further at this point in time. In fact the time is right for a ripping rally any time in the next 20-30 days.
Don't get embedded to scenarios, though. |
Great analysis done couple of years back. Nifty moved exactly. kudos to vimal 
|
|
| Back to top |
|
 |
|

