| View previous topic :: View next topic |
| Author |
CHARTS & PATTERNS |
shekharinvest
Yellow Belt

Joined: 21 Dec 2007
Posts: 549
|
|
| Back to top |
|
 |
|
|
 |
shekharinvest
Yellow Belt

Joined: 21 Dec 2007
Posts: 549
|
Post: #167  Posted: Sun Aug 04, 2013 7:26 am Post subject: Posted: Sun Aug 04, 2013 7:26 am Post subject: |
 |
|
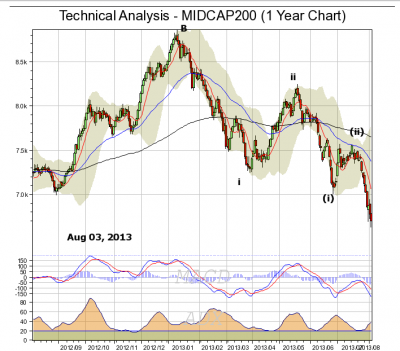
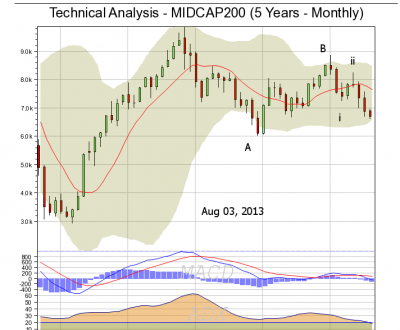
This chart gives us a fairly good idea when to buy Midcap stocks.
SHEKHAR
NB: I failed to find the constituents of MIDCAP200, if any body has a list or link kindly post.
| Description: |
|
| Filesize: |
57.13 KB |
| Viewed: |
418 Time(s) |
|
| Description: |
|
| Filesize: |
40.58 KB |
| Viewed: |
390 Time(s) |
|
Last edited by shekharinvest on Sun Aug 04, 2013 12:50 pm; edited 1 time in total |
|
| Back to top |
|
 |
shekharinvest
Yellow Belt

Joined: 21 Dec 2007
Posts: 549
|
Post: #168  Posted: Sun Aug 04, 2013 7:33 am Post subject: Posted: Sun Aug 04, 2013 7:33 am Post subject: |
 |
|
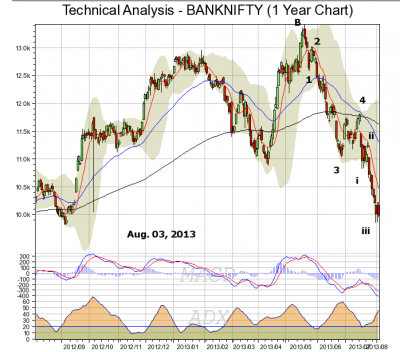
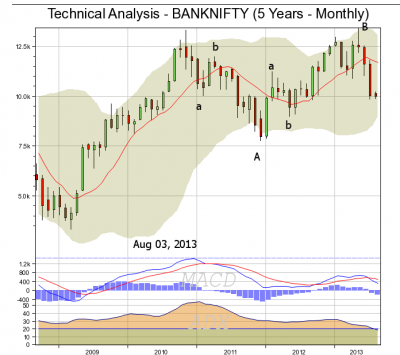
Banks are already down but this chart suggest that carnage (iii of C) is still pending.
SHEKHAR
| Description: |
|
| Filesize: |
59.14 KB |
| Viewed: |
456 Time(s) |
|
| Description: |
|
| Filesize: |
39.85 KB |
| Viewed: |
448 Time(s) |
|
|
|
| Back to top |
|
 |
saumya12
Brown Belt

Joined: 21 Dec 2011
Posts: 1509
|
Post: #169  Posted: Mon Aug 05, 2013 1:24 am Post subject: Posted: Mon Aug 05, 2013 1:24 am Post subject: |
 |
|
Hi Shekhar
I got the following symbols for Midcap 200
| Description: |
|

Download |
| Filename: |
CNX MIDCAP 200 list.txt |
| Filesize: |
1.38 KB |
| Downloaded: |
368 Time(s) |
|
|
| Back to top |
|
 |
saumya12
Brown Belt

Joined: 21 Dec 2011
Posts: 1509
|
|
| Back to top |
|
 |
shekharinvest
Yellow Belt

Joined: 21 Dec 2007
Posts: 549
|
Post: #171  Posted: Mon Aug 05, 2013 7:17 am Post subject: Posted: Mon Aug 05, 2013 7:17 am Post subject: |
 |
|
Thanks saumya12.
In next few months shall try to find some value picks from these, when they are supposed to be bottomed out as per my views.
SHEKHAR
|
|
| Back to top |
|
 |
shekharinvest
Yellow Belt

Joined: 21 Dec 2007
Posts: 549
|
Post: #172  Posted: Tue Aug 06, 2013 10:53 am Post subject: Posted: Tue Aug 06, 2013 10:53 am Post subject: |
 |
|
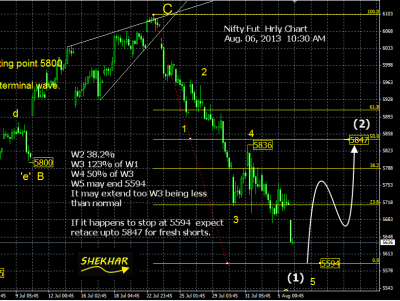
Nifty Update
Wave 1 may end at 5594 chart is self explanotary.
SHEKHAR
| Description: |
|
| Filesize: |
58.73 KB |
| Viewed: |
466 Time(s) |
|
|
|
| Back to top |
|
 |
saumya12
Brown Belt

Joined: 21 Dec 2011
Posts: 1509
|
Post: #173  Posted: Tue Aug 06, 2013 11:01 am Post subject: Posted: Tue Aug 06, 2013 11:01 am Post subject: |
 |
|
Thanks Shekhar for Nifty Update
But it is for Nifty or Nifty future, as the chart is of NF.
|
|
| Back to top |
|
 |
shekharinvest
Yellow Belt

Joined: 21 Dec 2007
Posts: 549
|
Post: #174  Posted: Tue Aug 06, 2013 11:14 am Post subject: Posted: Tue Aug 06, 2013 11:14 am Post subject: |
 |
|
| saumya12 wrote: | Thanks Shekhar for Nifty Update
But it is for Nifty or Nifty future, as the chart is of NF. |
Values are for Nifty Futures but it may differ slightly because of the data source.
SHEKHAR
|
|
| Back to top |
|
 |
saumya12
Brown Belt

Joined: 21 Dec 2011
Posts: 1509
|
Post: #175  Posted: Sat Aug 17, 2013 4:36 pm Post subject: Posted: Sat Aug 17, 2013 4:36 pm Post subject: |
 |
|
Hi Shekhar
Please try to post the latest EW chart incorporating the latest development with your comments.
Thanks
|
|
| Back to top |
|
 |
shekharinvest
Yellow Belt

Joined: 21 Dec 2007
Posts: 549
|
|
| Back to top |
|
 |
saumya12
Brown Belt

Joined: 21 Dec 2011
Posts: 1509
|
Post: #177  Posted: Sun Aug 18, 2013 11:06 am Post subject: Posted: Sun Aug 18, 2013 11:06 am Post subject: |
 |
|
Shekhar, many many thanks for the chart and your valuable comments.
| Description: |
|
| Filesize: |
44.28 KB |
| Viewed: |
404 Time(s) |

|
|
|
| Back to top |
|
 |
saumya12
Brown Belt

Joined: 21 Dec 2011
Posts: 1509
|
Post: #178  Posted: Sun Aug 18, 2013 12:14 pm Post subject: Posted: Sun Aug 18, 2013 12:14 pm Post subject: |
 |
|
Shekhar,
Is it possible for you to post EW chart in Hourly timeframe (with comments) as posted by you previously on 6.8.13
You will say that I demand too much 
But then the counts will be in continuity
and so it will help me in learning EW practically also.
Thanks.
|
|
| Back to top |
|
 |
rsnerella
White Belt

Joined: 30 Jul 2008
Posts: 153
|
Post: #179  Posted: Sun Aug 18, 2013 1:57 pm Post subject: CHARTS & PATTERNS Posted: Sun Aug 18, 2013 1:57 pm Post subject: CHARTS & PATTERNS |
 |
|
Nice projection,,, looks like almost upto 2014 first quarter...
| shekharinvest wrote: | | saumya12 wrote: | Hi Shekhar
Please try to post the latest EW chart incorporating the latest development with your comments.
Thanks |
C (3)(iii) has started from 5758 hence anticipate sharp falls as was seen on Friday. more to come 
W(iii)=W(i) gives TGT of 5169 approx next is 1.69% of W i which is assumed to be normal for W iii = 4806 approx.
Use this chart posted some time in June -as a guide map
So far done 5552>6102>
There is an alternate bullish count as well, shall post some time later but don't expect any respite until 5356 - 5172.
SHEKHAR |
|
|
| Back to top |
|
 |
shekharinvest
Yellow Belt

Joined: 21 Dec 2007
Posts: 549
|
|
| Back to top |
|
 |
|

