| View previous topic :: View next topic |
| Author |
CHARTS & PATTERNS |
saumya12
Brown Belt

Joined: 21 Dec 2011
Posts: 1509
|
Post: #196  Posted: Wed Dec 18, 2013 10:21 am Post subject: Re: maruti Posted: Wed Dec 18, 2013 10:21 am Post subject: Re: maruti |
 |
|
| rrk2006hyd wrote: | | rrk2006hyd wrote: | | rrk2006hyd wrote: | maruti...is this perfect swing trading example..can we enter as per swing trading?
sma 8 >ema(22)... |
who deleted my chart ? |
|
Must be removed by admin
Just look at the following post from an other thread
http://www.icharts.in/forum/posting,mode,quote,p,113733.html
| hemant.icharts wrote: | Dear Member,
Please abide by rules and regulation of forum. Charts from external sources (other websites, softwares etc) should not have the source indicated on the charts (website/software names must not be visible on the chart)
| Rebel wrote: | 5MIN NS CHART
[Content Removed by Admin] |
|
|
|
| Back to top |
|
 |
|
|
 |
rrk2006hyd
Yellow Belt

Joined: 13 Oct 2010
Posts: 874
|
Post: #197  Posted: Wed Dec 18, 2013 10:26 am Post subject: Re: maruti Posted: Wed Dec 18, 2013 10:26 am Post subject: Re: maruti |
 |
|
| saumya12 wrote: | | rrk2006hyd wrote: | | rrk2006hyd wrote: | | rrk2006hyd wrote: | maruti...is this perfect swing trading example..can we enter as per swing trading?
sma 8 >ema(22)... |
who deleted my chart ? |
|
Must be removed by admin
Just look at the following post from an other thread
http://www.icharts.in/forum/posting,mode,quote,p,113733.html
| hemant.icharts wrote: | Dear Member,
Please abide by rules and regulation of forum. Charts from external sources (other websites, softwares etc) should not have the source indicated on the charts (website/software names must not be visible on the chart)
| Rebel wrote: | 5MIN NS CHART
[Content Removed by Admin] |
|
|
thanks,saumya and hemant.. for the reply..... 
|
|
| Back to top |
|
 |
shekharinvest
Yellow Belt

Joined: 21 Dec 2007
Posts: 549
|
Post: #198  Posted: Wed Jan 22, 2014 2:16 pm Post subject: Posted: Wed Jan 22, 2014 2:16 pm Post subject: |
 |
|
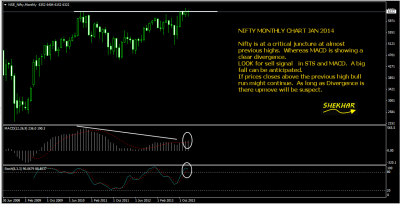
Nifty is at a critical juncture at almost previous highs. Whereas MACD is showing a clear divergence.
LOOK for sell signal in STS and MACD. A fall can be anticipated.
If prices closes above the previous high bull run might continue. As long as Divergence is there up move will be suspect.
Incidentally it also completes a part of C&H pattern as shown post few steps below.
Happy Trading !
SHEKHAR
| Description: |
|
| Filesize: |
48.44 KB |
| Viewed: |
556 Time(s) |
|
|
|
| Back to top |
|
 |
shekharinvest
Yellow Belt

Joined: 21 Dec 2007
Posts: 549
|
|
| Back to top |
|
 |
rk_a2003
Black Belt

Joined: 21 Jan 2010
Posts: 2734
|
Post: #200  Posted: Wed May 21, 2014 8:49 pm Post subject: Posted: Wed May 21, 2014 8:49 pm Post subject: |
 |
|
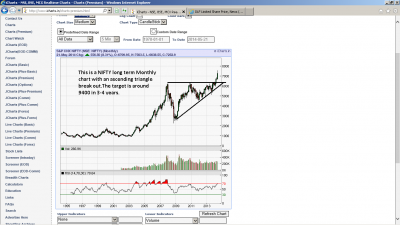
Nifty long term monthly chart...self explanatory.
| Description: |
|
| Filesize: |
76.22 KB |
| Viewed: |
548 Time(s) |
|
|
|
| Back to top |
|
 |
amitagg
Black Belt

Joined: 01 Oct 2013
Posts: 4559
|
Post: #201  Posted: Wed May 21, 2014 8:59 pm Post subject: Posted: Wed May 21, 2014 8:59 pm Post subject: |
 |
|
| rk_a2003 wrote: | | Nifty long term monthly chart...self explanatory. |
saw this else where...also....target not 9400 but 6300-2500=3800+6300=10100 approx.....entire max height of triangle..
|
|
| Back to top |
|
 |
rk_a2003
Black Belt

Joined: 21 Jan 2010
Posts: 2734
|
Post: #202  Posted: Wed May 21, 2014 9:12 pm Post subject: Posted: Wed May 21, 2014 9:12 pm Post subject: |
 |
|
| amitagg wrote: | | rk_a2003 wrote: | | Nifty long term monthly chart...self explanatory. |
saw this else where...also....target not 9400 but 6300-2500=3800+6300=10100 approx.....entire max height of triangle.. |
I have not seen it any where else. I derived target approx. just by eyeballing .Incase you want precise target as per math. It's 10461 (6357-2253=4104+6357=10461).
Over a period of 3-4 years whether it's 9000 or 10000 it may not matter more over it again depends on so many fundamental factors. I posted it just as an observation provided that if ALL IS WELL... it may reach that target.
|
|
| Back to top |
|
 |
saumya12
Brown Belt

Joined: 21 Dec 2011
Posts: 1509
|
Post: #203  Posted: Wed May 21, 2014 10:09 pm Post subject: Posted: Wed May 21, 2014 10:09 pm Post subject: |
 |
|
Hi Shekhar
You havnt posted Elliott Wave chart since long.
Please post latest chart, if possible for you.
Thanks
|
|
| Back to top |
|
 |
amitagg
Black Belt

Joined: 01 Oct 2013
Posts: 4559
|
Post: #204  Posted: Thu May 22, 2014 12:49 am Post subject: Posted: Thu May 22, 2014 12:49 am Post subject: |
 |
|
| rk_a2003 wrote: | | amitagg wrote: | | rk_a2003 wrote: | | Nifty long term monthly chart...self explanatory. |
saw this else where...also....target not 9400 but 6300-2500=3800+6300=10100 approx.....entire max height of triangle.. |
I have not seen it any where else. I derived target approx. just by eyeballing .Incase you want precise target as per math. It's 10461 (6357-2253=4104+6357=10461).
Over a period of 3-4 years whether it's 9000 or 10000 it may not matter more over it again depends on so many fundamental factors. I posted it just as an observation provided that if ALL IS WELL... it may reach that target. |
above gives 3-5 yr snapshot....by 2018-2020.....
Also if one draws a "parallel" from ascending traingle line, target is 8900.
....as per someone's EW count is 17400 Nifty Spot by 2025.....so at every stage it is a buy......and does not make trading any easier.... 
|
|
| Back to top |
|
 |
shekharinvest
Yellow Belt

Joined: 21 Dec 2007
Posts: 549
|
Post: #205  Posted: Fri Aug 29, 2014 2:23 pm Post subject: Posted: Fri Aug 29, 2014 2:23 pm Post subject: |
 |
|
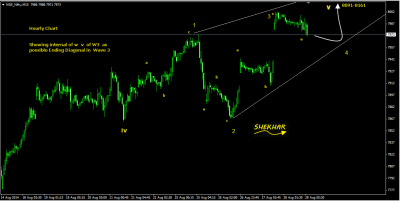
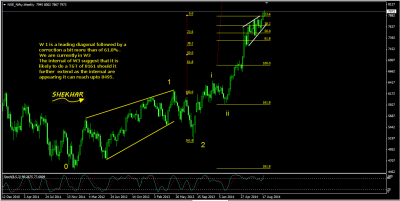
Starting from the lows of 4534 we had wave 1 as a leading diagonal ending at 6229. Wave 2 corrected to 61.8% + levels and thereafter we are enjoying a wave 3 move. (A possibility was suggested as an alternate count last Aug.)
For now W3 has already moved beyond normal i.e. more than 161.8% of wave 1 next possible extension is 176.2% or 200% at 8091 & 8495.
Now look at the internals of wave three starting from 5105 which appears to be nearing completion. W 3 ii retraced merely 38.2% of W 3 i, the normal end of wave 3 comes at 6181. If we further go down and look into what looks like a wave 3 v, it is forming an Ending Diagonal and we are at W 3 v (4).
In nutshell, keep an eye on 8091 -8161 range we may have a meaningful correction starting from there.
Happy Trading!
SHEKHAR 
| Description: |
|
| Filesize: |
33.25 KB |
| Viewed: |
581 Time(s) |
|
| Description: |
|
| Filesize: |
47.73 KB |
| Viewed: |
589 Time(s) |
|
|
|
| Back to top |
|
 |
a1b1trader
Yellow Belt

Joined: 13 Jul 2014
Posts: 691
|
Post: #206  Posted: Fri Aug 29, 2014 7:01 pm Post subject: Posted: Fri Aug 29, 2014 7:01 pm Post subject: |
 |
|
Thanks Shekhar
Its
Nice chart
Nice explanation
Please keep posting
|
|
| Back to top |
|
 |
shekharinvest
Yellow Belt

Joined: 21 Dec 2007
Posts: 549
|
Post: #207  Posted: Sat Sep 27, 2014 1:13 pm Post subject: Posted: Sat Sep 27, 2014 1:13 pm Post subject: |
 |
|
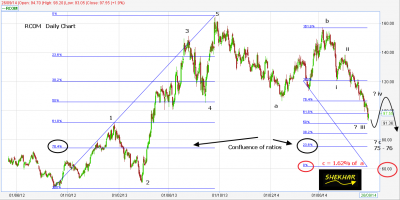
Starting from the low of 46.55 on 30/08/2013 RCOM was in an impulsive move which ended at 164.65 on 17/09/2013 a clear five wave up move can been observed.
17/09/2013 onwards RCOM is in correction mode wave a made a low of 106.75 followed by wave b up move which ended at 157.25 about 80% retrace of wave a.
Wave c down has started from 157.25 which is still continuing. A 61.8% retrace of the previous impulse comes at approx 91 and for now wave c has made a low of 93.05 on 26/09/2014.
Has wave c ended thus the correction completed ? The next impulsive wave is about to begin ???
Let us look closely into the wave c. Wave c always consist of 5 subwaves, here we can visualise that presently RCOM is in c (iii) (still on). c (iv) and c (v) are still on unfold.
Keeping all the above in mind we can for sure say that there is still some more downside left in the RCOM.
Where can this downfall end ? Some reasonable estimate/guess can be at 74-77 range which happens to be 76.4% retrace of the impulsive move and also 138.2% extension of corrective wave a. Confluence of Fibo ratios is one important region to lookout for.
If it goes deeper than the next lower level could be 64 approx. which happens to be 161.8% of the wave a what is quite normal for wave c to travel.
Once we are able to define the end point of wave c (iii) we will have a better estimation where the wave c could end. So keep a watch on the internals of wave c and catch the next BIG MOVE UP !!!
Happy trading !
SHEKHAR
NB: All Fibo values are approximation on visual basis they are not calculated values.
| Description: |
|
| Filesize: |
65.83 KB |
| Viewed: |
541 Time(s) |
|
|
|
| Back to top |
|
 |
kaydee11
White Belt

Joined: 29 Jan 2014
Posts: 79
|
Post: #208  Posted: Sat Sep 27, 2014 2:28 pm Post subject: Posted: Sat Sep 27, 2014 2:28 pm Post subject: |
 |
|
Shekhar Sir
NIFTY and BANKNIFTY charts with comments also. 
Thanks
|
|
| Back to top |
|
 |
shekharinvest
Yellow Belt

Joined: 21 Dec 2007
Posts: 549
|
Post: #209  Posted: Thu Oct 02, 2014 1:11 pm Post subject: Posted: Thu Oct 02, 2014 1:11 pm Post subject: |
 |
|
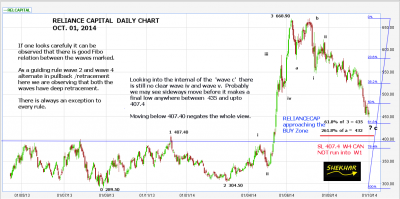
RECAPITAL:
Chart is self explanotary. Be prepared to buy soon.
Happy Trading !
Wishing a very Happy Vijaya Dashami to ALL!!!
SHEKHAR:mrgreen:
| Description: |
|
| Filesize: |
94.08 KB |
| Viewed: |
593 Time(s) |
|
|
|
| Back to top |
|
 |
ragarwal
Yellow Belt

Joined: 16 Nov 2008
Posts: 582
|
Post: #210  Posted: Thu Oct 02, 2014 2:48 pm Post subject: Posted: Thu Oct 02, 2014 2:48 pm Post subject: |
 |
|
| thankyou shekhar sir,an update on nifty and jpa please
|
|
| Back to top |
|
 |
|

