| View previous topic :: View next topic |
| Author |
CHARTS & PATTERNS |
amitagg
Black Belt

Joined: 01 Oct 2013
Posts: 4559
|
Post: #226  Posted: Sun Nov 02, 2014 6:37 pm Post subject: Posted: Sun Nov 02, 2014 6:37 pm Post subject: |
 |
|
| amitagg wrote: | | See my edited post below. |
Comment on 5th wave failure" possibility" is pending
|
|
| Back to top |
|
 |
|
|
 |
amitagg
Black Belt

Joined: 01 Oct 2013
Posts: 4559
|
Post: #227  Posted: Sun Nov 02, 2014 6:41 pm Post subject: Posted: Sun Nov 02, 2014 6:41 pm Post subject: |
 |
|
| shekharinvest wrote: | | amitagg wrote: | | rameshraja wrote: | Hello Shekar
Nice Analysis.. Hope you are trading well !! |
Do you see any gaps in analysis or all is all perfect here? If not , it is quite a thing. |
On the lighter note there are always lots of GAP in wave 3  |
And EW throws truly more than one possibility . Unless and unless seniors and other icharts can paint that "more than one" possibility and then derive why others are destined to failure , true EW study cannot be COMPLETE. Although we may still successfully trade on any One study and our prognosis.
So that element of debate and view has to come out from icharts forum then only it can enliven and broaden the analysis 
|
|
| Back to top |
|
 |
shekharinvest
Yellow Belt

Joined: 21 Dec 2007
Posts: 549
|
Post: #228  Posted: Sun Nov 02, 2014 6:51 pm Post subject: Posted: Sun Nov 02, 2014 6:51 pm Post subject: |
 |
|
| amitagg wrote: | | amitagg wrote: | | See my edited post below. |
Comment on 5th wave failure" possibility" is pending
Only thing is whether 5th wave failure shall occur in such circumstances for the v of your 3 wave starting 5116. That answer shall decide all.
|
5 th wave Failure: I do not remember as of now if there is any rule / guidline which tells us which 5th will fail, never had an opportunity to analyse that way. Anyway the internal of wave 5 will give an indication where it will gonna end.
I am not clear about which 5 th wave you are referring to. (v) of 3 has already moved past the high of wave 3 (iii) so it can't be termed as a failure.
SHEKHAR
|
|
| Back to top |
|
 |
amitagg
Black Belt

Joined: 01 Oct 2013
Posts: 4559
|
Post: #229  Posted: Sun Nov 02, 2014 7:20 pm Post subject: Posted: Sun Nov 02, 2014 7:20 pm Post subject: |
 |
|
| shekharinvest wrote: | | amitagg wrote: | | amitagg wrote: | | See my edited post below. |
Comment on 5th wave failure" possibility" is pending
Only thing is whether 5th wave failure shall occur in such circumstances for the v of your 3 wave starting 5116. That answer shall decide all.
|
5 th wave Failure: I do not remember as of now if there is any rule / guidline which tells us which 5th will fail, never had an opportunity to analyse that way. Anyway the internal of wave 5 will give an indication where it will gonna end.
I am not clear about which 5 th wave you are referring to. (v) of 3 has already moved past the high of wave 3 (iii) so it can't be termed as a failure.
SHEKHAR |
Yes there are rules for 5th wave failure but I am not remembering
Anyhow u are right on failure
So I shall move and say if there is a " truncation" ..... Just be alive to this since when the next target would come at 8900, there " under circumstances" when the wave 3 is ending as per you and me both , the 5th wave would not be much more left........ ( iii) was extended
If I can study over the next 2 days I shall come up with an explanation. But u shall observe later ( or I shall) that this 5th since many have " pattern" target of 8800-8900 also is likely to end below that
On very short term if nifty has cleared upper BB daily etc and nearing breakout Carmilla monthly pivots it time to be extremely carefull
Negative divergence is visible as well on weekly if I am not wrong
All systems would scream a " buy" only when the top happens........ Mark these words
Regard
|
|
| Back to top |
|
 |
rameshraja
Expert

Joined: 24 Nov 2006
Posts: 1121
|
Post: #230  Posted: Sun Nov 02, 2014 7:40 pm Post subject: Posted: Sun Nov 02, 2014 7:40 pm Post subject: |
 |
|
Mr Shekar
I am more into Gann methodology and I just follow that in toto. That doesn't mean I downgrade any other technical analysis.. I am more comfortable in Gann as levels are more accurate and has good strike rate.
Regarding Nifty Future, since it has takenout all time high, it could moveup further.. I feel bit jittery when I look at RSI value in Monthly chart of Nifty.. 
|
|
| Back to top |
|
 |
channasri
Green Belt

Joined: 01 Aug 2012
Posts: 1029
|
Post: #231  Posted: Sun Nov 02, 2014 9:48 pm Post subject: Appreciation Posted: Sun Nov 02, 2014 9:48 pm Post subject: Appreciation |
 |
|
Dear Shekharinvest,
I am very happy to note that you have learnt from Ilango. I am also learning from him. Hats off to him. Appreciate your efforts in helping many people here. You are appreciated by RR Sir. Excellent! Keep going.
Best regards,
Channasri
|
|
| Back to top |
|
 |
shekharinvest
Yellow Belt

Joined: 21 Dec 2007
Posts: 549
|
Post: #232  Posted: Sat Nov 08, 2014 5:47 pm Post subject: Posted: Sat Nov 08, 2014 5:47 pm Post subject: |
 |
|
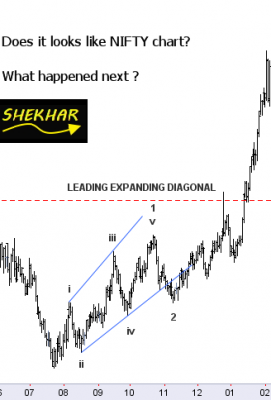
It is said that over the period of time 'Mass Psychology' remains the same. Group of people at different places behave in the same manner repeatedly.
Attached is a Chart which I came across going through my study material taken from the web some time back. The astonishing similarity with the NIFTY movement which we are witnessing these days caught my eyes.
I have cropped the chart to show approximately the stage where NIFTY is presently. Hope everybody sees what I am seeing.
Let me know If you agree.
SHEKHAR
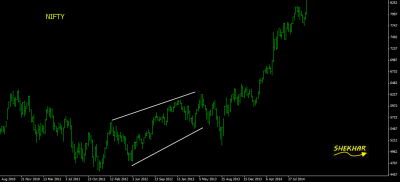
Also attached is the NIFTY chart posted by me few days back.
The security in the chart is different in a different time zone. Wave markings on the chart are by original author.
| Description: |
|
| Filesize: |
20.15 KB |
| Viewed: |
656 Time(s) |
|
| Description: |
|
| Filesize: |
26.84 KB |
| Viewed: |
635 Time(s) |
|
| Description: |
|
| Filesize: |
89.61 KB |
| Viewed: |
719 Time(s) |
|
|
|
| Back to top |
|
 |
amitagg
Black Belt

Joined: 01 Oct 2013
Posts: 4559
|
Post: #233  Posted: Sat Nov 08, 2014 10:24 pm Post subject: Posted: Sat Nov 08, 2014 10:24 pm Post subject: |
 |
|
what happened next....a rising wedge / channel after some sideways to down consolidation.......something which has already happened in Nifty after budget
(although the rise is still to happen in Nifty in same proportion i guess which would have come afterwards.....some more left may be as per this chart analogy.....)
interesting.......pls post answer when u get responses more.......
for me it is not at same stage.....if you believe yes....then answer to what happened next is severe fall........eagerly want to be proved wrong 
|
|
| Back to top |
|
 |
amitagg
Black Belt

Joined: 01 Oct 2013
Posts: 4559
|
Post: #234  Posted: Sun Nov 09, 2014 12:43 am Post subject: Posted: Sun Nov 09, 2014 12:43 am Post subject: |
 |
|
| amitagg wrote: | what happened next....a rising wedge / channel after some sideways to down consolidation.......something which has already happened in Nifty after budget
(although the rise is still to happen in Nifty in same proportion i guess which would have come afterwards.....some more left may be as per this chart analogy.....)
interesting.......pls post answer when u get responses more.......
for me it is not at same stage.....if you believe yes....then answer to what happened next is severe fall........eagerly want to be proved wrong  |
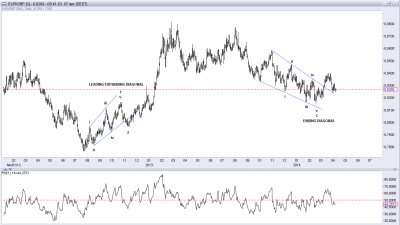
Also now is time to see not leading but ending diagonals
For that check dow Jones 1980 jan March chart if I am not wrong and see the impending slide....... And nifty comparison to possible slide pending till 7500
|
|
| Back to top |
|
 |
shekharinvest
Yellow Belt

Joined: 21 Dec 2007
Posts: 549
|
Post: #235  Posted: Mon Nov 10, 2014 9:27 am Post subject: Posted: Mon Nov 10, 2014 9:27 am Post subject: |
 |
|
| shekharinvest wrote: | It is said that over the period of time 'Mass Psychology' remains the same. Group of people at different places behave in the same manner repeatedly.
Attached is a Chart which I came across going through my study material taken from the web some time back. The astonishing similarity with the NIFTY movement which we are witnessing these days caught my eyes.
I have cropped the chart to show approximately the stage where NIFTY is presently. Hope everybody sees what I am seeing.
Let me know If you agree.
SHEKHAR
Also attached is the NIFTY chart posted by me few days back.
The security in the chart is different in a different time zone. Wave markings on the chart are by original author. |
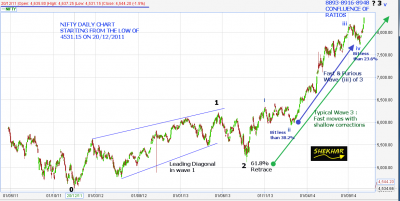
If history repeats. Nifty may take the following route going forward.
SHEKHAR
| Description: |
|
| Filesize: |
75.37 KB |
| Viewed: |
661 Time(s) |
|
|
|
| Back to top |
|
 |
amit0666
White Belt

Joined: 23 Jun 2010
Posts: 86
|
Post: #236  Posted: Tue Nov 11, 2014 3:18 pm Post subject: Posted: Tue Nov 11, 2014 3:18 pm Post subject: |
 |
|
| hello shekhar brother good work done there by you can you post crude gold and silver charts with ew counts . regards amit
|
|
| Back to top |
|
 |
amitagg
Black Belt

Joined: 01 Oct 2013
Posts: 4559
|
Post: #237  Posted: Tue Nov 11, 2014 6:27 pm Post subject: Posted: Tue Nov 11, 2014 6:27 pm Post subject: |
 |
|
| amit0666 wrote: | | hello shekhar brother good work done there by you can you post crude gold and silver charts with ew counts . regards amit |
Would love it if done both on monthly and daily time frames.
Always difficult to have faith in any EW count ( at least i am unable to track on larger time frames successfully)
|
|
| Back to top |
|
 |
shekharinvest
Yellow Belt

Joined: 21 Dec 2007
Posts: 549
|
Post: #238  Posted: Wed Nov 12, 2014 9:57 am Post subject: Posted: Wed Nov 12, 2014 9:57 am Post subject: |
 |
|
Amit & Amit
I do not follow commodities. But due to curiosity created because of 'Vomiting Camel' and Talk of gold reaching 16000 (also seen welgrow post Gold reaching 16000) had a look at Gold chart last week and done some preliminary calculations. It seems possible although the EW route could be different still to workout.
As you are aware of, it takes considerable time to create and post charts shall try to post the same ASAP
amitagg wrote: Always difficult to have faith in any EW count
Take longer term EW counts as guide for the direction and take position in the given direction as per your trade set up it gona help you make money.
SHEKHAR
|
|
| Back to top |
|
 |
amit0666
White Belt

Joined: 23 Jun 2010
Posts: 86
|
Post: #239  Posted: Wed Nov 12, 2014 12:36 pm Post subject: Posted: Wed Nov 12, 2014 12:36 pm Post subject: |
 |
|
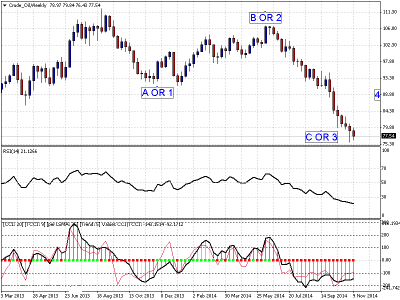
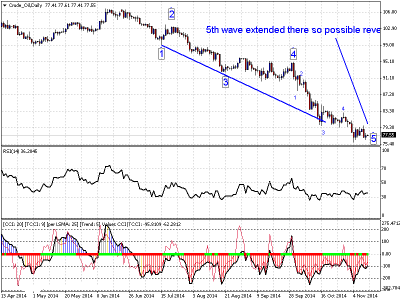
plz check these charts from your side shekhar sir
| Description: |
|
| Filesize: |
25.86 KB |
| Viewed: |
565 Time(s) |
|
| Description: |
|
| Filesize: |
29.53 KB |
| Viewed: |
573 Time(s) |
|
|
|
| Back to top |
|
 |
amitagg
Black Belt

Joined: 01 Oct 2013
Posts: 4559
|
Post: #240  Posted: Thu Nov 13, 2014 4:30 pm Post subject: Posted: Thu Nov 13, 2014 4:30 pm Post subject: |
 |
|
these are apparently over simplistic markings for crude........may be simple is the way to go!!!! 
|
|
| Back to top |
|
 |
|

