| View previous topic :: View next topic |
| Author |
CHARTS & PATTERNS |
shekharinvest
Yellow Belt

Joined: 21 Dec 2007
Posts: 549
|
Post: #256  Posted: Mon Mar 16, 2015 9:21 am Post subject: Posted: Mon Mar 16, 2015 9:21 am Post subject: |
 |
|
| amitagg wrote: | Hi
Can u update this please. Your 8900 targets are well met and your below euro GBT chart trying to correlate with Nifty as you suggest ,chart suggests fall till 8000 followed by rise till 8500 and then fall back to 8000 and rise in round pattern to 9000 followed by fall in channel- I may well be " terribly wrong" here so please guide what import are u deriving from the inter market analysis
Regards
Amit
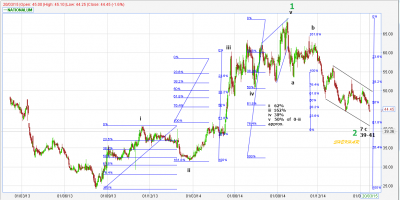
| shekharinvest wrote: | | shekharinvest wrote: | It is said that over the period of time 'Mass Psychology' remains the same. Group of people at different places behave in the same manner repeatedly.
Attached is a Chart which I came across going through my study material taken from the web some time back. The astonishing similarity with the NIFTY movement which we are witnessing these days caught my eyes.
I have cropped the chart to show approximately the stage where NIFTY is presently. Hope everybody sees what I am seeing.
Let me know If you agree.
SHEKHAR
Also attached is the NIFTY chart posted by me few days back.
The security in the chart is different in a different time zone. Wave markings on the chart are by original author. |
If history repeats. Nifty may take the following route going forward.
SHEKHAR |
|
Amit
I do not venture where there is no clarity. If it indeed is wave 4 then expect it to be confusing and confounding (generally). When ever I will form a view I shall definitely post here. Until then wait and watch.
As for the comparison of NIFTY with the EUR/GBP chart that was purely to initiate a thought process for the academic purposes only. We may or may not follow that path.
Happy Trading !
SHEKHAR 
|
|
| Back to top |
|
 |
|
|
|
AMBY
Yellow Belt
Joined: 05 Sep 2014
Posts: 503
|
| Post: #257 Posted: Mon Mar 16, 2015 9:26 am Post subject: R.COM |
|
|
| THANKS FOR UPDATE.
|
|
| Back to top |
|
|
amitagg
Black Belt

Joined: 01 Oct 2013
Posts: 4559
|
| Post: #258 Posted: Mon Mar 16, 2015 2:15 pm Post subject: |
|
|
Shekar
Are u in some blog active of yours
Can say yes or no
Regards
|
|
| Back to top |
|
|
shekharinvest
Yellow Belt
Joined: 21 Dec 2007
Posts: 549
|
| Post: #259 Posted: Tue Mar 17, 2015 9:35 am Post subject: |
|
|
| amitagg wrote: | Shekar
Are u in some blog active of yours
Can say yes or no
Regards |
Amit I do post on my blog but I am more active here. You can imagine... 
|
|
| Back to top |
|
|
shekharinvest
Yellow Belt
Joined: 21 Dec 2007
Posts: 549
|
|
| Back to top |
|
|
shekharinvest
Yellow Belt
Joined: 21 Dec 2007
Posts: 549
|
|
| Back to top |
|
|
vinay28
Black Belt
Joined: 24 Dec 2010
Posts: 11748
|
| Post: #262 Posted: Tue Jul 14, 2015 1:38 pm Post subject: |
|
|
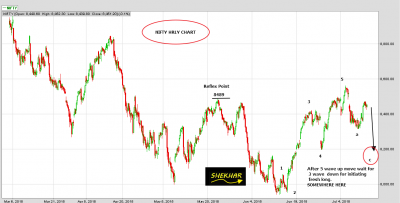
| shekharinvest wrote: | Attached along is a Nifty hourly chart. One can wait for NIFTY to correct upto 8250 > 8180 to initiate fresh longs.
Happy Trading!
SHEKHAR |
shekhar SL?
|
|
| Back to top |
|
|
amitagg
Black Belt
Joined: 01 Oct 2013
Posts: 4559
|
| Post: #263 Posted: Tue Jul 14, 2015 3:18 pm Post subject: |
|
|
Stop loss as per EW can only be bottom of wave 1 - 7940. Yes Shekhar?
This pattern shall still support Inverse Head and Shoulder in making and seems quite reasonable. It ties with other harmonic projections to 8073 etc.
It also seems psychologically reasonable with undertone of bullishness still to give way.....
last time, Shekhar correctly predicted markets at 8900 when they were are 7800-8000.....and hit the near top.
|
|
| Back to top |
|
|
vinay28
Black Belt
Joined: 24 Dec 2010
Posts: 11748
|
| Post: #264 Posted: Tue Jul 14, 2015 7:27 pm Post subject: |
|
|
| SL may be above 8561 or 60tf close above 8546?
|
|
| Back to top |
|
|
shekharinvest
Yellow Belt
Joined: 21 Dec 2007
Posts: 549
|
| Post: #265 Posted: Wed Jul 15, 2015 8:35 am Post subject: |
|
|
Amit, you are right SL for longs is below the start of wave 1.
Vinay you seems to be asking for SL for shorts for the ensuing wave c.
First the hypothesis.
A fresh impulsive wave has started from the low of 7940 and it has done a 5 wave move up i.e. wave 1 is done wave 2 to follow which generally retraces 62% of the move hence 8175. But often times wave 2 retraces merely 38% in the present case where I have marked end of wave a that is exactly 38% of the prior move probably the next wave 'the wave 3' has begun (only time will tell).
Since wave 2 retraces 62% generally hence I marked that point as 'a' and waiting for an up move as in wave 'b' to be followed be wave 'c'. Where the 'c' will end depends from where it starts.
Now wave 'b' can retrace by any amount say from 38% to 123% of wave 'a' leading upto as high as 8615. Wave 'b' are the treacherous waves difficult to predict may take any shape Zig Zag/Triangle/ Flat correction /Expanded Flat.
It is better to wait until some clarity develops. If we see sharp rise as in wave three time to long and if there is confusing move certainly wave 'b' is in play.
Going short with SL at 8561 is a legitimate trade for TGT of 62%, 100% or 162% of wave 'a' from whereever wave 'b' ends.
SHEKHAR
|
|
| Back to top |
|
|
vinay28
Black Belt
Joined: 24 Dec 2010
Posts: 11748
|
| Post: #266 Posted: Wed Jul 15, 2015 10:25 am Post subject: |
|
|
many tks shekhar. yes I was asking SL for short. I am still long progressively booking my calls but I am thinking of shorting above 8540 with NS touching 8562 as SL. Obviously I don't understand EW.
tks again.
|
|
| Back to top |
|
|
shekharinvest
Yellow Belt
Joined: 21 Dec 2007
Posts: 549
|
|
| Back to top |
|
|
amitagg
Black Belt
Joined: 01 Oct 2013
Posts: 4559
|
| Post: #268 Posted: Sat Jan 02, 2016 6:25 pm Post subject: |
|
|
Thanks as always for the great refined analysis
Can there be extensions in both minor wave 3 of 3tf and 5tf wave simultaneously. Does smaller wave 1 and wave 2 qualify as impulse and correction by sub divisions . just a check . Not that I believe otherwise.
|
|
| Back to top |
|
|
rameshraja
Expert

Joined: 24 Nov 2006
Posts: 1121
|
| Post: #269 Posted: Sat Jan 02, 2016 6:40 pm Post subject: |
|
|
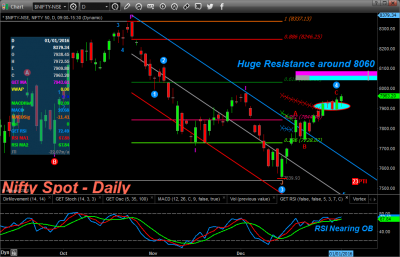
Hello shekhar
Please see the attached Nifty Spot Daily chart.. First Resistance around 8060 and if it manages to hold this, probably could move towards 8250 and stall around that Level.
C T RAMESH RAJA
SEBI RA REGD NO: INH200001673
| Description: |
|
| Filesize: |
90.57 KB |
| Viewed: |
650 Time(s) |
|
|
|
| Back to top |
|
|
shekharinvest
Yellow Belt
Joined: 21 Dec 2007
Posts: 549
|
| Post: #270 Posted: Sun Jan 03, 2016 11:04 am Post subject: |
|
|
| amitagg wrote: | Thanks as always for the great refined analysis
Can there be extensions in both minor wave 3 of 3tf and 5tf wave simultaneously. Does smaller wave 1 and wave 2 qualify as impulse and correction by sub divisions . just a check . Not that I believe otherwise. |
Amit
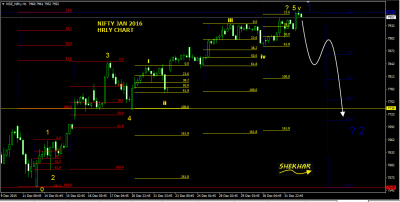
Can there be extensions in both minor wave 3 of 3tf and 5tf wave simultaneously.
I could not get what you mean?
Does smaller wave 1 and wave 2 qualify as impulse and correction by sub divisions
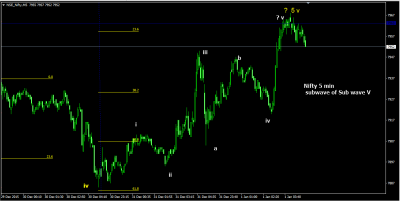
Yes off course. Elliot wave is Fractal in nature i.e. each wave (impulse)
consist of 5 sub waves 3 impulse and 2 corrective waves. You can
keep going lower but it gets difficult to identify, waves are clear on
Higher TF.
Here is further possible subdivision of Subwave v for which chart was posted yesterday, I have made no calculations just as seen by eye.
| Description: |
|
| Filesize: |
18.31 KB |
| Viewed: |
556 Time(s) |
|
|
|
| Back to top |
|
|
|