| View previous topic :: View next topic |
| Author |
CHARTS & PATTERNS |
shekharinvest
Yellow Belt

Joined: 21 Dec 2007
Posts: 549
|
Post: #271  Posted: Sun Jan 03, 2016 11:12 am Post subject: Posted: Sun Jan 03, 2016 11:12 am Post subject: |
 |
|
| rameshraja wrote: | Hello shekhar
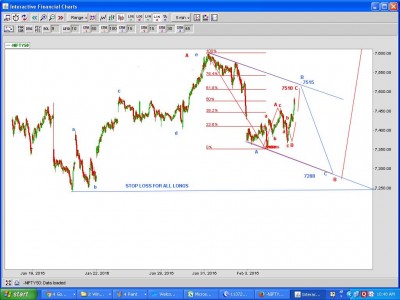
Please see the attached Nifty Spot Daily chart.. First Resistance around 8060 and if it manages to hold this, probably could move towards 8250 and stall around that Level.
C T RAMESH RAJA
SEBI RA REGD NO: INH200001673 |
RR Sir,
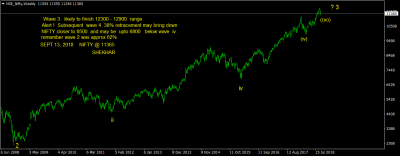
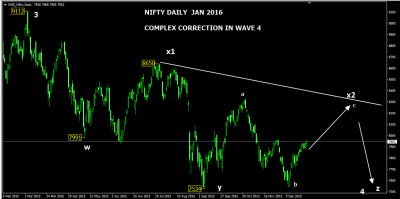
It's always enlightening to have your perspective. My view is biased because I am following a larger wave 4 experiencing a complex correction and expecting a 5 wave up move as in wave c to reach a possible TGT close to 8300 min as defined by the down trendline on the chart enclosed and can go upto 8400.
| Description: |
|
| Filesize: |
34.37 KB |
| Viewed: |
615 Time(s) |
|
|
|
| Back to top |
|
 |
|
|
|
amitagg
Black Belt

Joined: 01 Oct 2013
Posts: 4559
|
| Post: #272 Posted: Mon Jan 04, 2016 1:49 pm Post subject: |
|
|
| shekharinvest wrote: | | amitagg wrote: | Thanks as always for the great refined analysis
Can there be extensions in both minor wave 3 of 3tf and 5tf wave simultaneously. Does smaller wave 1 and wave 2 qualify as impulse and correction by sub divisions . just a check . Not that I believe otherwise. |
Amit
Can there be extensions in both minor wave 3 of 3tf and 5tf wave simultaneously.
I could not get what you mean?
Does smaller wave 1 and wave 2 qualify as impulse and correction by sub divisions
Yes off course. Elliot wave is Fractal in nature i.e. each wave (impulse)
consist of 5 sub waves 3 impulse and 2 corrective waves. You can
keep going lower but it gets difficult to identify, waves are clear on
Higher TF.
Here is further possible subdivision of Subwave v for which chart was posted yesterday, I have made no calculations just as seen by eye. |
My dear I was not sure so was checking. You made the market fall  cherish your posts since last time as well you predicted it right. Your analysis always helps. cherish your posts since last time as well you predicted it right. Your analysis always helps.
|
|
| Back to top |
|
|
amitagg
Black Belt
Joined: 01 Oct 2013
Posts: 4559
|
| Post: #273 Posted: Mon Jan 04, 2016 1:53 pm Post subject: |
|
|
| shekharinvest wrote: | | amitagg wrote: | Thanks as always for the great refined analysis
Can there be extensions in both minor wave 3 of 3tf and 5tf wave simultaneously. Does smaller wave 1 and wave 2 qualify as impulse and correction by sub divisions . just a check . Not that I believe otherwise. |
Amit
Can there be extensions in both minor wave 3 of 3tf and 5tf wave simultaneously.
I could not get what you mean?
Does smaller wave 1 and wave 2 qualify as impulse and correction by sub divisions
Yes off course. Elliot wave is Fractal in nature i.e. each wave (impulse)
consist of 5 sub waves 3 impulse and 2 corrective waves. You can
keep going lower but it gets difficult to identify, waves are clear on
Higher TF.
Here is further possible subdivision of Subwave v for which chart was posted yesterday, I have made no calculations just as seen by eye. |
My dear I was not sure so was checking. You made the market fall cherish your posts since last time as well you predicted it right. Your analysis always helps.
|
|
| Back to top |
|
|
dynamite_munda11
Yellow Belt
Joined: 14 Nov 2010
Posts: 681
|
| Post: #274 Posted: Sat Feb 06, 2016 6:31 pm Post subject: nifty |
|
|
just a view
| Description: |
|
| Filesize: |
95.57 KB |
| Viewed: |
680 Time(s) |
|
|
|
| Back to top |
|
|
dynamite_munda11
Yellow Belt
Joined: 14 Nov 2010
Posts: 681
|
| Post: #275 Posted: Tue Feb 09, 2016 9:18 am Post subject: nifty |
|
|
| 7288 spot trgts done
|
|
| Back to top |
|
|
shekharinvest
Yellow Belt
Joined: 21 Dec 2007
Posts: 549
|
| Post: #276 Posted: Sat Jul 30, 2016 12:01 pm Post subject: |
|
|
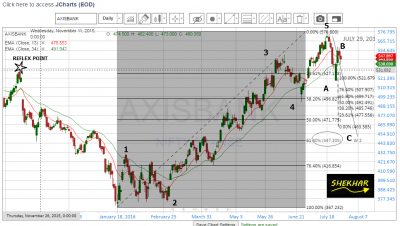
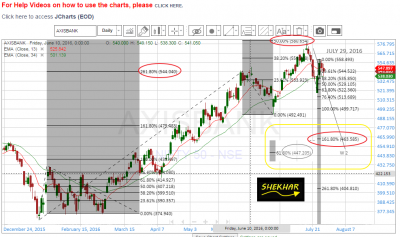
In middle of January Axis Bank made a Low at 367 and from there on until the end of February it remained in a range which with the benefit of hindsight can now be labelled as Wave 1 & Wave 2 where Wave 2 is deep -more than 80% and complex in nature. Wave 3 which traveled upto 545 was an extended wave and was 262% of wave 1 followed by wave 4 which was shallow and simple in nature. As the wave 3 was extended wave 5 was expected to be shorter and it failed to achieve 62% of 0-3 distance in fact it was tad short of 50%. So far everything fits well in the wave theory.
Assuming 5 wave completed at 577 a decent 3 wave decline is expected as in wave 2 / B of higher degree. Also note that this 5 wave move has crossed the reflex point it could be the signal to change of trend and fresh buying can be initiated at the end of 3 wave move down, which can be anticipated at 62% of the whole move or about 162% of wave A as tentatively marked on the chart as of now which gives us the range of 463 – 447 to keep watch on.
Happy Trading !
SHEKHAR 
| Description: |
|
| Filesize: |
114.93 KB |
| Viewed: |
592 Time(s) |
|
| Description: |
|
| Filesize: |
135.05 KB |
| Viewed: |
551 Time(s) |
|
|
|
| Back to top |
|
|
chetan83
Brown Belt

Joined: 19 Feb 2010
Posts: 2036
|
| Post: #277 Posted: Tue May 08, 2018 4:09 pm Post subject: BEML-EOD |
|
|
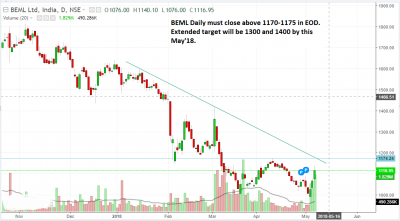
BEML has made a perfect double bottom with bullish divergence in EOD.
A Close above 1170-1175 on EOD basis with take it to 1300-1400.
SL 1120 (closing basis)
| Description: |
|
| Filesize: |
52.38 KB |
| Viewed: |
486 Time(s) |
|
|
|
| Back to top |
|
|
kishjk7551
White Belt

Joined: 26 Jan 2008
Posts: 293
|
| Post: #278 Posted: Wed May 09, 2018 8:49 am Post subject: Re: BEML-EOD |
|
|
| chetan83 wrote: | BEML has made a perfect double bottom with bullish divergence in EOD.
A Close above 1170-1175 on EOD basis with take it to 1300-1400.
SL 1120 (closing basis) |
Chetan Bhai please start your own thread very difficult to keep at track of your posts 
|
|
| Back to top |
|
|
chetan83
Brown Belt
Joined: 19 Feb 2010
Posts: 2036
|
| Post: #279 Posted: Wed May 09, 2018 1:23 pm Post subject: Re: BEML-EOD |
|
|
| kishjk7551 wrote: | | chetan83 wrote: | BEML has made a perfect double bottom with bullish divergence in EOD.
A Close above 1170-1175 on EOD basis with take it to 1300-1400.
SL 1120 (closing basis) |
Chetan Bhai please start your own thread very difficult to keep at track of your posts |
Hi,
I had started a thread "A tribute to my teachers" long ago, will try to update the patterns and possible trend from its outcome in that thread going forward.
Regards,
Chetan.
|
|
| Back to top |
|
|
shekharinvest
Yellow Belt
Joined: 21 Dec 2007
Posts: 549
|
|
| Back to top |
|
|
|