| View previous topic :: View next topic |
| Author |
CHARTS & PATTERNS |
shekharinvest
Yellow Belt

Joined: 21 Dec 2007
Posts: 549
|
Post: #31  Posted: Sat Oct 22, 2011 8:55 pm Post subject: Re: Hi Posted: Sat Oct 22, 2011 8:55 pm Post subject: Re: Hi |
 |
|
| sandew wrote: | Shekhar,
just to say hi to you
Sandew |
Sandew, its nice to see you.
Wish you and your family Happy Diwali.
SHEKHAR
|
|
| Back to top |
|
 |
|
|
|
ravionlinek
White Belt

Joined: 11 Jun 2010
Posts: 97
|
| Post: #32 Posted: Sun Oct 23, 2011 7:08 pm Post subject: reading chart |
|
|
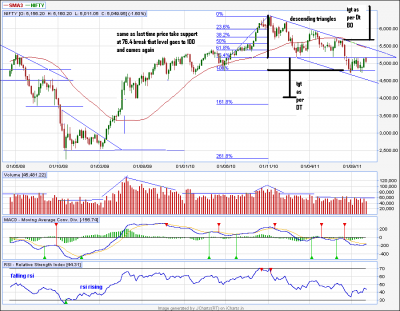
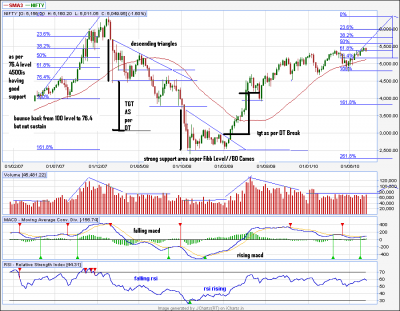
Is i m reading chart correctly???
ur view ichartians
| Description: |
|
| Filesize: |
46.71 KB |
| Viewed: |
732 Time(s) |
|
| Description: |
|
| Filesize: |
49.87 KB |
| Viewed: |
673 Time(s) |
|
|
|
| Back to top |
|
|
sandew
White Belt
Joined: 02 Feb 2009
Posts: 174
|
| Post: #33 Posted: Mon Oct 24, 2011 11:47 am Post subject: Happy Deepawli |
|
|
Shekhar,
Wishing you too a prosperous Deepawli
and
to all ichart readers here.
Sanjeev
|
|
| Back to top |
|
|
ravionlinek
White Belt
Joined: 11 Jun 2010
Posts: 97
|
| Post: #34 Posted: Mon Oct 24, 2011 11:04 pm Post subject: |
|
|
reply expert 
|
|
| Back to top |
|
|
The game
White Belt
Joined: 04 Mar 2011
Posts: 46
|
| Post: #35 Posted: Tue Oct 25, 2011 6:51 pm Post subject: |
|
|
shekharinvest Sir plz check your inbox 
|
|
| Back to top |
|
|
shekharinvest
Yellow Belt
Joined: 21 Dec 2007
Posts: 549
|
| Post: #36 Posted: Sun Oct 30, 2011 8:01 pm Post subject: |
|
|
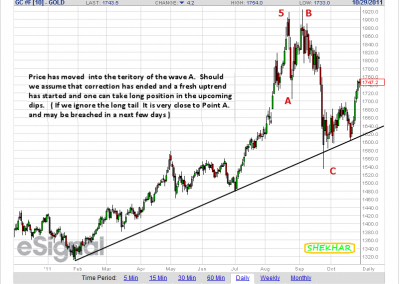
Has gold resumed uptrend ?
Well I am going to buy few Gold ETFs in the next dip. ( I don't have a comm account) For sure once it takes a dip after moving past 1762 bit wary of that long tail.
SHEKHAR
| Description: |
|
| Filesize: |
49.34 KB |
| Viewed: |
619 Time(s) |
|
|
|
| Back to top |
|
|
shekharinvest
Yellow Belt
Joined: 21 Dec 2007
Posts: 549
|
| Post: #37 Posted: Wed Nov 02, 2011 6:45 am Post subject: |
|
|
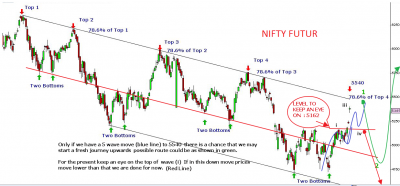
Shaddo's chart posted for future reference.
| Description: |
|
| Filesize: |
279 KB |
| Viewed: |
728 Time(s) |
|
|
|
| Back to top |
|
|
vimalmehta
White Belt
Joined: 07 Apr 2009
Posts: 20
|
| Post: #38 Posted: Fri Nov 04, 2011 9:13 pm Post subject: |
|
|
| shekharinvest wrote: | | Shaddo's chart posted for future reference. |
Good analysis buddy
|
|
| Back to top |
|
|
shekharinvest
Yellow Belt
Joined: 21 Dec 2007
Posts: 549
|
| Post: #39 Posted: Sat Nov 05, 2011 7:23 am Post subject: |
|
|
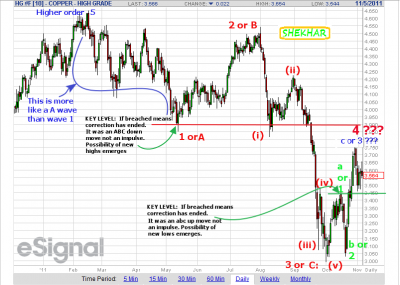
Copper has achieved almost 50% retracement level as suggested in the previous posts. Further move depends upon the key levels marked on the chart. Dominant view is downwards as suggested previously. (Refer post Dtd Oct. 08, 2011)
SHEKHAR
| Description: |
|
| Filesize: |
61.9 KB |
| Viewed: |
659 Time(s) |
|
|
|
| Back to top |
|
|
ragarwal
Yellow Belt
Joined: 16 Nov 2008
Posts: 582
|
| Post: #40 Posted: Sun Nov 06, 2011 9:51 pm Post subject: |
|
|
| thnx shekhar it means v cn take a short position if copper breaks 3.45
|
|
| Back to top |
|
|
shekharinvest
Yellow Belt
Joined: 21 Dec 2007
Posts: 549
|
| Post: #41 Posted: Mon Nov 07, 2011 5:45 am Post subject: |
|
|
| ragarwal wrote: | | thnx shekhar it means v cn take a short position if copper breaks 3.45 |
Yes, it does opens up an opportunity to go short.
SHEKHAR
|
|
| Back to top |
|
|
ragarwal
Yellow Belt
Joined: 16 Nov 2008
Posts: 582
|
| Post: #42 Posted: Mon Nov 07, 2011 9:43 am Post subject: |
|
|
grt shekhar,when copper was quoting at a little just over 3 in september it seemed impossible for it to go to 3.585.now this too seems impossible.
thnx:)
|
|
| Back to top |
|
|
ragarwal
Yellow Belt
Joined: 16 Nov 2008
Posts: 582
|
| Post: #43 Posted: Mon Nov 07, 2011 9:58 am Post subject: |
|
|
grt shekhar,when copper was quoting at a little just over 3 in september it seemed impossible for it to go to 3.585.now this too seems impossible.
thnx:)
|
|
| Back to top |
|
|
subbuibm
White Belt
Joined: 21 Jul 2009
Posts: 3
|
| Post: #44 Posted: Mon Nov 07, 2011 8:35 pm Post subject: Re: CHARTS & PATTERNS |
|
|
| shekharinvest wrote: | Nifty is forming a possible H&S pattern on hourly chart. A breakout above 5600 will confirm the pattern and Nifty can TGT approx 5900 NS.
Keep patience and be on the alert until then.
SHEKHAR |
Thanks for the analysis.
At what level this chart pattern becomes invalid?
Subbu
|
|
| Back to top |
|
|
bolband_macd
White Belt
Joined: 06 Sep 2011
Posts: 104
|
| Post: #45 Posted: Tue Nov 08, 2011 4:55 pm Post subject: Bearish Gartley Chart Pattern |
|
|
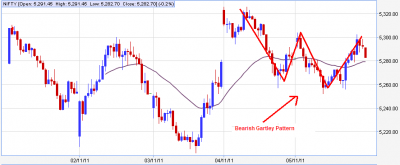
Friends,
Noticed bearish Chart Pattern in today's NF 15tf. Will there be a fall in nifty? Lets watch tomorrow.
Experts comments on this chart are most welcome so as to fine tune the chart pattern.
Trade safe.
BM
| Description: |
|
| Filesize: |
22.66 KB |
| Viewed: |
553 Time(s) |
|
|
|
| Back to top |
|
|
|


