| View previous topic :: View next topic |
| Author |
CHARTS & PATTERNS |
shekharinvest
Yellow Belt

Joined: 21 Dec 2007
Posts: 549
|
Post: #1  Posted: Mon Feb 21, 2011 7:22 pm Post subject: CHARTS & PATTERNS Posted: Mon Feb 21, 2011 7:22 pm Post subject: CHARTS & PATTERNS |
 |
|
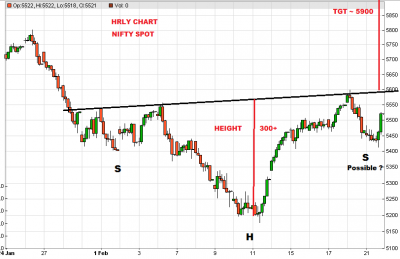
Nifty is forming a possible H&S pattern on hourly chart. A breakout above 5600 will confirm the pattern and Nifty can TGT approx 5900 NS.
Keep patience and be on the alert until then.
SHEKHAR
| Description: |
|
| Filesize: |
21.72 KB |
| Viewed: |
1169 Time(s) |
|
Last edited by shekharinvest on Mon Aug 29, 2011 8:19 pm; edited 1 time in total |
|
| Back to top |
|
 |
|
|
 |
singh.ravee
Yellow Belt

Joined: 12 Aug 2010
Posts: 678
|
Post: #2  Posted: Mon Feb 21, 2011 7:36 pm Post subject: Posted: Mon Feb 21, 2011 7:36 pm Post subject: |
 |
|
Shekhar Sir,
I am using basic charts and i dont get data for volumes on nifty.
I would like to learn How can we evaluate the volume aspect of h&s or triangles?
Can any indicator be used as a substitute of volume.
thanks and regards
ravee
|
|
| Back to top |
|
 |
trades4girish
White Belt

Joined: 10 Jul 2009
Posts: 22
|
|
| Back to top |
|
 |
shekharinvest
Yellow Belt

Joined: 21 Dec 2007
Posts: 549
|
Post: #4  Posted: Tue Feb 22, 2011 1:03 pm Post subject: Posted: Tue Feb 22, 2011 1:03 pm Post subject: |
 |
|
Ravee,
I have not seen vol. on NS intra charts. Although, it is available on NSE TAMe but the Intra chart itslef is only for current day.
http://www.nseindia.com/ChartApp/install/charts/mainpage.jsp
Probably, PT could be of some help. If possible they could have already made available. 
Girish,
It does not looks like C&H the cup part should have a rounding bottom kind of formation over a period of time, where as here we have a sharp/vertical fall prior to bottom formation.
Do give importance to volume also as ravee has pointed out.
SHEKHAR
|
|
| Back to top |
|
 |
jjm
White Belt

Joined: 17 Mar 2010
Posts: 411
|
Post: #5  Posted: Wed Feb 23, 2011 6:56 pm Post subject: Bank India Posted: Wed Feb 23, 2011 6:56 pm Post subject: Bank India |
 |
|
Hi
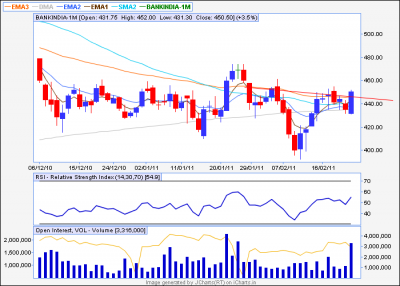
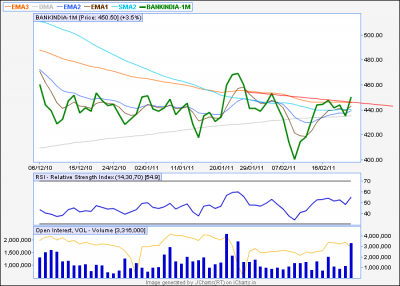
A case of classic confluence as well as IHNS
Regards,
JJM 
| Description: |
|
| Filesize: |
25.52 KB |
| Viewed: |
943 Time(s) |
|
| Description: |
|
| Filesize: |
32.43 KB |
| Viewed: |
851 Time(s) |
|
|
|
| Back to top |
|
 |
shekharinvest
Yellow Belt

Joined: 21 Dec 2007
Posts: 549
|
|
| Back to top |
|
 |
singh.ravee
Yellow Belt

Joined: 12 Aug 2010
Posts: 678
|
Post: #7  Posted: Sat Jul 23, 2011 9:31 am Post subject: Posted: Sat Jul 23, 2011 9:31 am Post subject: |
 |
|
| shekharinvest wrote: | WISHFUL THINKING !!!  |
 flag n pole flag n pole  
|
|
| Back to top |
|
 |
ajayhkaul
Yellow Belt

Joined: 18 Jun 2009
Posts: 866
|
Post: #8  Posted: Sat Jul 23, 2011 10:04 am Post subject: On the Right Track Posted: Sat Jul 23, 2011 10:04 am Post subject: On the Right Track |
 |
|
| Shekharinvest is on the right track - pending breakout from the flag formation
|
|
| Back to top |
|
 |
nsinojia
Yellow Belt

Joined: 21 Dec 2009
Posts: 624
|
Post: #9  Posted: Sat Jul 23, 2011 11:33 am Post subject: Posted: Sat Jul 23, 2011 11:33 am Post subject: |
 |
|
| shekharinvest wrote: | WISHFUL THINKING !!!  |
shekharinvest thanks for the chart i do agree with your views
|
|
| Back to top |
|
 |
nsinojia
Yellow Belt

Joined: 21 Dec 2009
Posts: 624
|
|
| Back to top |
|
 |
marne.vivek
White Belt

Joined: 11 Apr 2008
Posts: 244
Location: Pune / Mumbai
|
Post: #11  Posted: Sat Jul 23, 2011 12:20 pm Post subject: NIFTY Breakout Posted: Sat Jul 23, 2011 12:20 pm Post subject: NIFTY Breakout |
 |
|
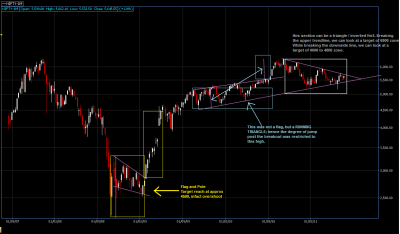
Nifty does not seems to sport a FLAG..
Rather a triangle / slanting inverted Head and Shoulder and also a Normal head and Shoulder, which is plastered across all the blogs following Nifty.
| Description: |
|
| Filesize: |
56.23 KB |
| Viewed: |
845 Time(s) |
|
_________________
Vivek |
|
| Back to top |
|
 |
shekharinvest
Yellow Belt

Joined: 21 Dec 2007
Posts: 549
|
Post: #12  Posted: Mon Aug 29, 2011 8:37 pm Post subject: Posted: Mon Aug 29, 2011 8:37 pm Post subject: |
 |
|
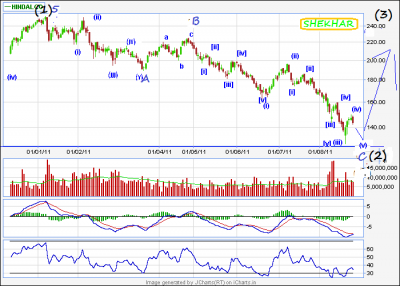
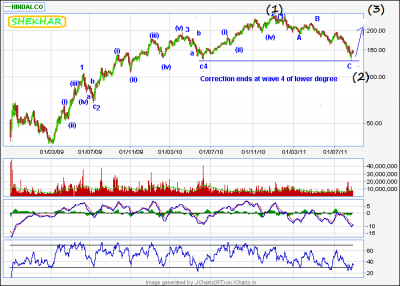
With new found interest in Elliot waves I have placed wave counts as per my understanding.
Chart 1 gives a larger perspective and the Chart 2 details the correction.
I request fellow boarders who follow EW ( I know there are quite a few who are good at counts ) to kindly evaluate the charts and comment.
Charts are HINDALCO EOD 26/08/2011
SHEKHAR
| Description: |
|
| Filesize: |
31 KB |
| Viewed: |
810 Time(s) |
|
| Description: |
|
| Filesize: |
33.31 KB |
| Viewed: |
834 Time(s) |
|
|
|
| Back to top |
|
 |
vimalmehta
White Belt

Joined: 07 Apr 2009
Posts: 20
|
Post: #13  Posted: Mon Sep 19, 2011 1:23 pm Post subject: NIFTY 2 YEAR WAVE COUNT. Posted: Mon Sep 19, 2011 1:23 pm Post subject: NIFTY 2 YEAR WAVE COUNT. |
 |
|
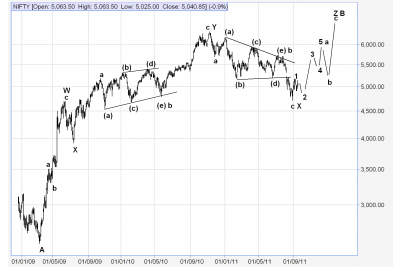
This is how i view the nifty count currently. A cycle wave triple zigzag in the making. I would have thought that a double zigzag at the November 2010 top would be sufficient for Cycle wave B, But the subsequent market correction for 9 months has been a clear ABC with wave B as a triangle. Lot of Bad news and bearish sentiment overall right now, i can't see the market going down further at this point in time. In fact the time is right for a ripping rally any time in the next 20-30 days.
Don't get embedded to scenarios, though.
| Description: |
|
| Filesize: |
97 KB |
| Viewed: |
812 Time(s) |
|
|
|
| Back to top |
|
 |
vinay28
Black Belt

Joined: 24 Dec 2010
Posts: 11748
|
Post: #14  Posted: Mon Sep 19, 2011 2:07 pm Post subject: Posted: Mon Sep 19, 2011 2:07 pm Post subject: |
 |
|
vimal, don't come and go like a comet 
|
|
| Back to top |
|
 |
vimalmehta
White Belt

Joined: 07 Apr 2009
Posts: 20
|
Post: #15  Posted: Mon Sep 19, 2011 4:28 pm Post subject: Posted: Mon Sep 19, 2011 4:28 pm Post subject: |
 |
|
| vinay28 wrote: | vimal, don't come and go like a comet  |
LOL Sorry I'll stick around
|
|
| Back to top |
|
 |
|

