| View previous topic :: View next topic |
| Author |
CHROME 5 MIN TF, EMA 107/200 STRATEGY FAILS |
SID2060
White Belt

Joined: 04 Nov 2009
Posts: 319
|
Post: #1  Posted: Sun Sep 26, 2010 9:30 pm Post subject: CHROME 5 MIN TF, EMA 107/200 STRATEGY FAILS Posted: Sun Sep 26, 2010 9:30 pm Post subject: CHROME 5 MIN TF, EMA 107/200 STRATEGY FAILS |
 |
|
Dear icharts.in Members and Guests,
Chrome has recently shared with us his 5min tf, ema 107/200 strategy which we all have appreciated including me...
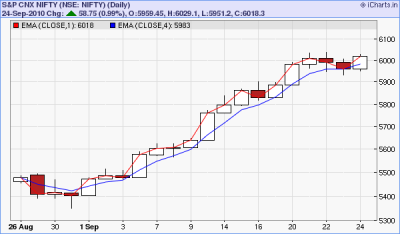
Today i found a substitute an ema combination in daily charts which would generate same entry and exit levels like chomes strategy perform for us in his 5min tf
That ema crossover combination is ema 1 and ema 4.... These combinations used in daily charts would generate the same results which chrome's strategy generates in his 5min tf strategy...
I am attaching the daily charts for ur reference......
| Description: |
|
| Filesize: |
16.52 KB |
| Viewed: |
452 Time(s) |

|
Last edited by SID2060 on Sun Sep 26, 2010 10:42 pm; edited 3 times in total |
|
| Back to top |
|
 |
|
|
 |
SID2060
White Belt

Joined: 04 Nov 2009
Posts: 319
|
Post: #2  Posted: Sun Sep 26, 2010 9:41 pm Post subject: Posted: Sun Sep 26, 2010 9:41 pm Post subject: |
 |
|
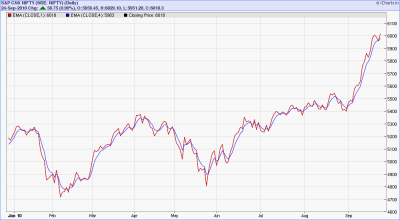
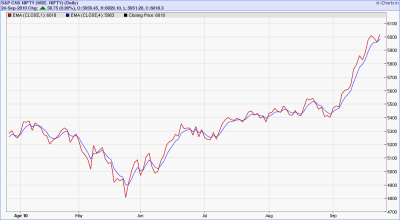
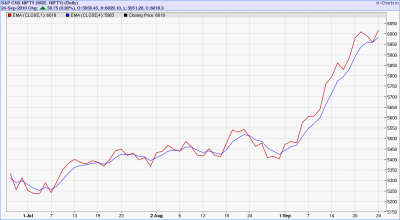
Now coming to the point i wanna show u the amount of wipshaws this strategy got by attaching a 3 months, 6 months and 9 months daily chart using ema 1/4 combination which is the same as using ema 107/200 in 5min tf.....
No doubt that this strategy has done good job for the month of september 2010 by giving good buy signal and no sell signal till date but it has performed so badly in the past that makes me crazy 
| Description: |
|
| Filesize: |
42.23 KB |
| Viewed: |
412 Time(s) |

|
| Description: |
|
| Filesize: |
37.96 KB |
| Viewed: |
413 Time(s) |

|
| Description: |
|
| Filesize: |
35.08 KB |
| Viewed: |
411 Time(s) |

|
|
|
| Back to top |
|
 |
SID2060
White Belt

Joined: 04 Nov 2009
Posts: 319
|
Post: #3  Posted: Sun Sep 26, 2010 9:55 pm Post subject: Posted: Sun Sep 26, 2010 9:55 pm Post subject: |
 |
|
Now i tell u how i calculated the ema for daily charts
Chrome uses 107/200 strategy in 5 min time frame
now in chromes strategy if we convert 107/200 in minutes than it become
107*5 (multiply by 5 coz its for 5min tf) = 535 minutes
200*5 =1000 minutes
now in a day there are 6.5 hours of trading session (in india) that is 6.5*60 min = 390 min in a day
Now substitute of ema 107 of 5min tf : 535 min divide by 390 min = 1.37
And substitute for ema 200 of 5min tf: 1000 min divide by 390 min = 2.56
I have round off the decimal points and using ema 1 and ema 4. If i use the exact 1.37 and 2.56 then this combination will only results into more whipshaws than the approx emas that i am using...
Regards
Sid 
|
|
| Back to top |
|
 |
SID2060
White Belt

Joined: 04 Nov 2009
Posts: 319
|
|
| Back to top |
|
 |
SID2060
White Belt

Joined: 04 Nov 2009
Posts: 319
|
Post: #5  Posted: Sun Sep 26, 2010 10:37 pm Post subject: Posted: Sun Sep 26, 2010 10:37 pm Post subject: |
 |
|
THE SOLUTION.....................
FOR SWING AND SHORT TERM TRADING PURPOSE AVOID USING CHROME'S STRATEGY IF U WANT TO EARN CONSISTENTLY............
Instead of that use in daily charts ema 5/13 and ema 9/18 strategy........ From these strategies u will earn consistently and it generates very few wipshaws and wrong signals.............. ema 5/13 and ema 9/18 strategy in daily charts is even recommended by Sir John Murphy for Swing and short term trading.............
TRY OUT THESE COMBINATION'S IN NIFTY DAILY CHARTS AND SEE THE DIFFERENCE...................
Regards,
SID 
|
|
| Back to top |
|
 |
chetan83
Brown Belt

Joined: 19 Feb 2010
Posts: 2037
|
Post: #6  Posted: Mon Sep 27, 2010 12:39 am Post subject: Startegy Posted: Mon Sep 27, 2010 12:39 am Post subject: Startegy |
 |
|
| SID2060 wrote: | Now i tell u how i calculated the ema for daily charts
Chrome uses 107/200 strategy in 5 min time frame
now in chromes strategy if we convert 107/200 in minutes than it become
107*5 (multiply by 5 coz its for 5min tf) = 535 minutes
200*5 =1000 minutes
now in a day there are 6.5 hours of trading session (in india) that is 6.5*60 min = 390 min in a day
Now substitute of ema 107 of 5min tf : 535 min divide by 390 min = 1.37
And substitute for ema 200 of 5min tf: 1000 min divide by 390 min = 2.56
I have round off the decimal points and using ema 1 and ema 4. If i use the exact 1.37 and 2.56 then this combination will only results into more whipshaws than the approx emas that i am using...
Regards
Sid  |
Hi Sid,
Thanks for lucid explanation on the calculation for EMA for daily charts. Can u pls also explain us the same for Commodity market. There is 13.5 hrs of trading session (10am-11:30pm), if we do the same calculation in 107/200 EMA, we gets the 1st at 0.6 and other as 1.23, so how to plot the graphs?? Do revert.
regards,
Chetan.
|
|
| Back to top |
|
 |
girishhu1
White Belt

Joined: 17 Aug 2009
Posts: 316
|
Post: #7  Posted: Mon Sep 27, 2010 4:27 am Post subject: Posted: Mon Sep 27, 2010 4:27 am Post subject: |
 |
|
SID wrot '
Now coming to the point i wanna show u the amount of wipshaws this strategy got by attaching a 3 months, 6 months and 9 months daily chart using ema 1/4 combination which is the same as using ema 107/200 in 5min tf.....
No doubt that this strategy has done good job for the month of september 2010 by giving good buy signal and no sell signal till date but it has performed so badly in the past that makes me crazy 40'
hi sid,
any strategy based on ema will work only if markets are trending . in a trading market such a strategy will result in whipsaws.
|
|
| Back to top |
|
 |
chrome
Yellow Belt

Joined: 28 Dec 2009
Posts: 645
|
Post: #8  Posted: Mon Sep 27, 2010 8:33 am Post subject: Posted: Mon Sep 27, 2010 8:33 am Post subject: |
 |
|
| SID2060 wrote: | THE SOLUTION.....................
FOR SWING AND SHORT TERM TRADING PURPOSE AVOID USING CHROME'S STRATEGY IF U WANT TO EARN CONSISTENTLY............
Instead of that use in daily charts ema 5/13 and ema 9/18 strategy........ From these strategies u will earn consistently and it generates very few wipshaws and wrong signals.............. ema 5/13 and ema 9/18 strategy in daily charts is even recommended by Sir John Murphy for Swing and short term trading.............
TRY OUT THESE COMBINATION'S IN NIFTY DAILY CHARTS AND SEE THE DIFFERENCE...................
Regards,
SID  |
Sid, i dont know why u are always behind my ema strategy and why u always get excited in finding different 'substitutes' of 107/200 crossover strategy. I have never forced to apply this strategy on ur trading so if u dont find it good, then plz ignore it,simple..before criticizing anyone's post plz get ur mind clear with the help of charts and i told u this earlier too. U seem to b so fascinated with ema's that u treat them as holy grail, which practically is not.
Plz restrict urself from criticizing me again in this public forum.
|
|
| Back to top |
|
 |
sherbaaz
Yellow Belt

Joined: 27 May 2009
Posts: 543
|
Post: #9  Posted: Mon Sep 27, 2010 8:56 am Post subject: Posted: Mon Sep 27, 2010 8:56 am Post subject: |
 |
|
| chrome wrote: | | SID2060 wrote: | THE SOLUTION.....................
FOR SWING AND SHORT TERM TRADING PURPOSE AVOID USING CHROME'S STRATEGY IF U WANT TO EARN CONSISTENTLY............
Instead of that use in daily charts ema 5/13 and ema 9/18 strategy........ From these strategies u will earn consistently and it generates very few wipshaws and wrong signals.............. ema 5/13 and ema 9/18 strategy in daily charts is even recommended by Sir John Murphy for Swing and short term trading.............
TRY OUT THESE COMBINATION'S IN NIFTY DAILY CHARTS AND SEE THE DIFFERENCE...................
Regards,
SID  |
Sid, i dont know why u are always behind my ema strategy and why u always get excited in finding different 'substitutes' of 107/200 crossover strategy. I have never forced to apply this strategy on ur trading so if u dont find it good, then plz ignore it,simple..before criticizing anyone's post plz get ur mind clear with the help of charts and i told u this earlier too. U seem to b so fascinated with ema's that u treat them as holy grail, which practically is not.
Plz restrict urself from criticizing me again in this public forum. |
Rightly said by chrome
reagrds,
|
|
| Back to top |
|
 |
SID2060
White Belt

Joined: 04 Nov 2009
Posts: 319
|
Post: #10  Posted: Mon Sep 27, 2010 8:59 am Post subject: Re: Startegy Posted: Mon Sep 27, 2010 8:59 am Post subject: Re: Startegy |
 |
|
| chetan83 wrote: | | SID2060 wrote: | Now i tell u how i calculated the ema for daily charts
Chrome uses 107/200 strategy in 5 min time frame
now in chromes strategy if we convert 107/200 in minutes than it become
107*5 (multiply by 5 coz its for 5min tf) = 535 minutes
200*5 =1000 minutes
now in a day there are 6.5 hours of trading session (in india) that is 6.5*60 min = 390 min in a day
Now substitute of ema 107 of 5min tf : 535 min divide by 390 min = 1.37
And substitute for ema 200 of 5min tf: 1000 min divide by 390 min = 2.56
I have round off the decimal points and using ema 1 and ema 4. If i use the exact 1.37 and 2.56 then this combination will only results into more whipshaws than the approx emas that i am using...
Regards
Sid  |
Hi Sid,
Thanks for lucid explanation on the calculation for EMA for daily charts. Can u pls also explain us the same for Commodity market. There is 13.5 hrs of trading session (10am-11:30pm), if we do the same calculation in 107/200 EMA, we gets the 1st at 0.6 and other as 1.23, so how to plot the graphs?? Do revert.
regards,
Chetan. |
The reason for starting this post is to let every1 stay away frm 107/200 strategy in 5min tf. This is coz of the amount of wipshaws it generates. Dnt use this strategy in stock commodities or other financial instruments. U can use the emas i mentioned in the solution.
|
|
| Back to top |
|
 |
SID2060
White Belt

Joined: 04 Nov 2009
Posts: 319
|
Post: #11  Posted: Mon Sep 27, 2010 9:13 am Post subject: Posted: Mon Sep 27, 2010 9:13 am Post subject: |
 |
|
Instead of using ema 5/13 or 9/18 in daily charts, frndz u can also use ema 34/89 or 60/120 in 60 min chart tf as u r comfortable trading with.
Regards
Sid
|
|
| Back to top |
|
 |
chrome
Yellow Belt

Joined: 28 Dec 2009
Posts: 645
|
Post: #12  Posted: Mon Sep 27, 2010 9:19 am Post subject: Posted: Mon Sep 27, 2010 9:19 am Post subject: |
 |
|
| request the admin to plz intervene and let Sid know about forum etiquettes and let him refrain from publicaly criticizing me.
|
|
| Back to top |
|
 |
SID2060
White Belt

Joined: 04 Nov 2009
Posts: 319
|
Post: #13  Posted: Mon Sep 27, 2010 9:41 am Post subject: Posted: Mon Sep 27, 2010 9:41 am Post subject: |
 |
|
so chrome u want me to send private messages instead of public. I dun have that much time. Chrome fail ho gaya.
Admin m sory if i broke any rules. But when ppl can appreciate a strategy in public then why not criticize?
|
|
| Back to top |
|
 |
SwingTrader
Site Admin
Joined: 11 Aug 2006
Posts: 2903
Location: Hyderabad, India
|
Post: #14  Posted: Mon Sep 27, 2010 10:01 am Post subject: Posted: Mon Sep 27, 2010 10:01 am Post subject: |
 |
|
THIS THREAD IS LOCKED FOR FURTHER INVESTIGATION. I WILL SEE HAS TO BE DONE.
_________________
Srikanth Kurdukar
@SwingTrader |
|
| Back to top |
|
 |
SwingTrader
Site Admin
Joined: 11 Aug 2006
Posts: 2903
Location: Hyderabad, India
|
Post: #15  Posted: Mon Sep 27, 2010 10:34 am Post subject: Posted: Mon Sep 27, 2010 10:34 am Post subject: |
 |
|
SID2060,
You are free to politely criticize any user's strategy in that particular user's strategy thread. Chrome has criticized your strategy in your thread politely. You are free to do the same in chrome's strategy thread - again politely - or keep replying to him in your thread when he posts there. Whatever you do you will have to do it politely, we are trying to learn from each other here. Where is the question of fighting here? There was no need to start a separate thread to criticize another user, it is a violation of our forum usage rules.
Let us just drop this topic here and continue ahead. Please continue to post about your strategy. Chrome will continue his strategy. Let everyone learn whatever is good from both strategies.
Thanks.
_________________
Srikanth Kurdukar
@SwingTrader |
|
| Back to top |
|
 |
|

