| View previous topic :: View next topic |
| Author |
Commodities |
sherbaaz
Yellow Belt

Joined: 27 May 2009
Posts: 543
|
Post: #16  Posted: Wed Jul 03, 2013 12:34 pm Post subject: Posted: Wed Jul 03, 2013 12:34 pm Post subject: |
 |
|
| sherbaaz wrote: | copper 4h chart looking good to go long. it looks lke that there is lots of buying happened around 400 level.
regds, |
copper rocking!
regds,
|
|
| Back to top |
|
 |
|
|
|
sherbaaz
Yellow Belt
Joined: 27 May 2009
Posts: 543
|
| Post: #17 Posted: Sat Jul 06, 2013 11:53 pm Post subject: |
|
|
crude today made a high of 6440 last high was 6333. it looks to me that the price is rigged. it could be a trap for retailers who are long.
upside may be limited from here or sharp fall may come.
int to watch in coming weeks.
regds,
|
|
| Back to top |
|
|
welgro
Brown Belt

Joined: 24 Sep 2012
Posts: 1784
|
|
| Back to top |
|
|
sherbaaz
Yellow Belt
Joined: 27 May 2009
Posts: 543
|
| Post: #19 Posted: Fri Aug 23, 2013 9:30 pm Post subject: |
|
|
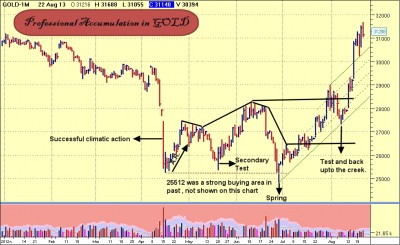
below is a an eod chart of gold future showing how professional accumulation happened in it around 25k.
aggressive entry was 25655 on spring. where as conservative, which i prefer was at the back upto the creek or the test bar @ 27718.
regds,
"one only need simple price volume chart to read the footprints of professional activity"
| Description: |
|
| Filesize: |
451.93 KB |
| Viewed: |
557 Time(s) |
|
|
|
| Back to top |
|
|
bharatpatel
White Belt

Joined: 26 Oct 2011
Posts: 401
|
| Post: #20 Posted: Sat Aug 24, 2013 7:35 am Post subject: hi |
|
|
Dear Sherbaaz,
Your valuable inputs on nifty and selected scripts ..... please, if you have time.
|
|
| Back to top |
|
|
sherbaaz
Yellow Belt
Joined: 27 May 2009
Posts: 543
|
| Post: #21 Posted: Tue Sep 03, 2013 8:16 pm Post subject: |
|
|
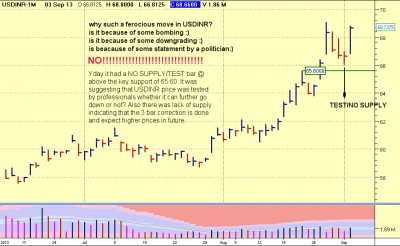
hindsight EOD chart of USDINR.
with price and volume one can find the foot prints of elephant (professionals).
| Description: |
|
| Filesize: |
379.65 KB |
| Viewed: |
559 Time(s) |
|
|
|
| Back to top |
|
|
bharatpatel
White Belt
Joined: 26 Oct 2011
Posts: 401
|
| Post: #22 Posted: Wed Sep 04, 2013 8:39 am Post subject: |
|
|
| sherbaaz wrote: | hindsight EOD chart of USDINR.
with price and volume one can find the foot prints of elephant (professionals). |
Dear Sherbaaz,
It is surprising that you do not use any indicators people use to analyse charts. I am impressed by your way of analysis. You are doing what i was supposed / trying to do that is just PURE PRICE ACTION & VOLUME. Great ... keep it up bro.....
|
|
| Back to top |
|
|
sherbaaz
Yellow Belt
Joined: 27 May 2009
Posts: 543
|
| Post: #23 Posted: Fri Sep 06, 2013 10:04 am Post subject: |
|
|
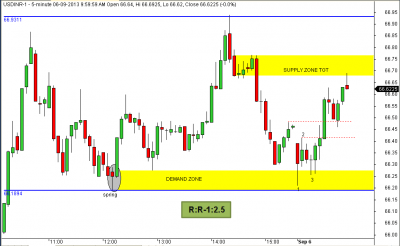
USDINR M5 chart trading @ the danger point.
"Trading is simply a transfer of money from those who don't know what they are doing, into the accounts of those who do know what they are doing."--Sam Seiden
| Description: |
|
| Filesize: |
17.38 KB |
| Viewed: |
513 Time(s) |
|
|
|
| Back to top |
|
|
sherbaaz
Yellow Belt
Joined: 27 May 2009
Posts: 543
|
| Post: #24 Posted: Fri Sep 06, 2013 5:43 pm Post subject: |
|
|
Dear Admin,
Kindly close this thread. I have nothing more to add.
Regards,
S
|
|
| Back to top |
|
|
|