| View previous topic :: View next topic |
| Author |
Commodities |
sherbaaz
Yellow Belt

Joined: 27 May 2009
Posts: 543
|
Post: #1  Posted: Sat Mar 03, 2012 10:38 am Post subject: Commodities Posted: Sat Mar 03, 2012 10:38 am Post subject: Commodities |
 |
|
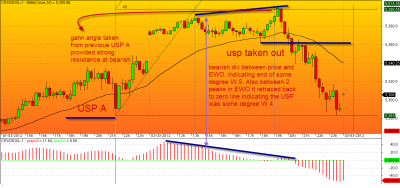
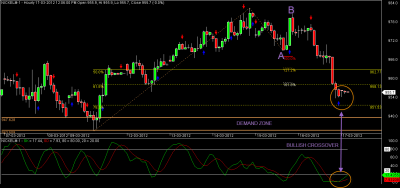
Attached is the chart of Crude Oil 15M of 02-03-2012 fall from high.
Again I have tried to align EW,SSPS and GANN. EWO oscillator showing bearish divergence at the high indicating that the up move of price was not supported by the momentum in some degree of W.5. Between the divergence EOW pulled back to zeroline indicating that USP was formed at the end of some degree of W.4.
Gann resistance @ 5398 proved to be strong resistance as it came at the end of W.5 (actual high in price was 5400).
A breakout of USP added fuel to the fall.
Regards,
| Description: |
|
| Filesize: |
67.97 KB |
| Viewed: |
695 Time(s) |
|
|
|
| Back to top |
|
 |
|
|
|
sherbaaz
Yellow Belt
Joined: 27 May 2009
Posts: 543
|
| Post: #2 Posted: Fri Mar 16, 2012 12:23 pm Post subject: Nickel- 1M EOD |
|
|
Attached is the chart of Nickel - 1M EOD.
Regds,
| Description: |
|
| Filesize: |
50.54 KB |
| Viewed: |
607 Time(s) |
|
|
|
| Back to top |
|
|
sherbaaz
Yellow Belt
Joined: 27 May 2009
Posts: 543
|
| Post: #3 Posted: Fri Mar 16, 2012 9:51 pm Post subject: |
|
|
In continuation to the below mentioned chart of NICKEL-1M eod, attached is the hourly chart of nickel mini it looks like we may get a buying opportunity.
| Description: |
|
| Filesize: |
31.25 KB |
| Viewed: |
577 Time(s) |
|
|
|
| Back to top |
|
|
sethu45
White Belt

Joined: 06 Aug 2009
Posts: 168
|
| Post: #4 Posted: Sat Mar 17, 2012 11:31 am Post subject: |
|
|
Yes Nickel is coming to buying opportunity. Last time it came to 943 and immediately went and closed above 950. But if it penetrates 943 can go further down by 30 rs. What is your opinion on thanks. Crude went down to 5322 and immediately jumped. As of now res stands at 5390-5407. Being an international commodity sometimes mcx is not allowing the scrips to scale high due to exchange rates etc in India.
are you suggesting to buy nickel at this rate.
|
|
| Back to top |
|
|
veerappan
Expert

Joined: 19 Dec 2007
Posts: 3680
|
| Post: #5 Posted: Sat Mar 17, 2012 11:34 am Post subject: |
|
|
for nickel just come back after 981 closing basis then sl shd be 14 pts.. and target of 1030-1049-1088... if it closes below 926 then -888-842-778 also possible... 
|
|
| Back to top |
|
|
sherbaaz
Yellow Belt
Joined: 27 May 2009
Posts: 543
|
| Post: #6 Posted: Sat Mar 17, 2012 12:12 pm Post subject: |
|
|
| sethu45 wrote: | Yes Nickel is coming to buying opportunity. Last time it came to 943 and immediately went and closed above 950. But if it penetrates 943 can go further down by 30 rs. What is your opinion on thanks. Crude went down to 5322 and immediately jumped. As of now res stands at 5390-5407. Being an international commodity sometimes mcx is not allowing the scrips to scale high due to exchange rates etc in India.
are you suggesting to buy nickel at this rate. |
Dear Mr. Sethu,
I am not suggesting anything. The charts I post is to share some of my probable trades with fellow traders.
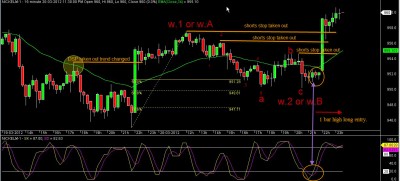
Yday night at the time of posting nickel mini was in a strong demand zone and it looks to me its in W.C correction currently. It has already broken the demand zone I have marked on chart and also 61.8% fibo level. next support for it 78.6%.
You are right 974-943 is the next strong demand zone. If broken it may further fall.
Hourly Oscillator has given a bullish crossover with 4H oscillator OS. I will prefer to take 1 bar high long entry on Monday if I get a chance.
Kindly share and comment.
Regds,
| Description: |
|
| Filesize: |
23.28 KB |
| Viewed: |
565 Time(s) |
|
| Description: |
|
| Filesize: |
33.67 KB |
| Viewed: |
527 Time(s) |
|
|
|
| Back to top |
|
|
sethu45
White Belt
Joined: 06 Aug 2009
Posts: 168
|
| Post: #7 Posted: Sun Mar 18, 2012 5:37 am Post subject: |
|
|
Dear Sherbaaz,
Thanks for your postings. Let us wait for good opportunity to buy. If any commodity getting crushed which means a good buying opportunity at lower levels. See Mr. Veerappan also gave some more good levels to buy as each commodity has got their own price and no commodity will be retained at lower price for ever. The oscilations are temporary. I will start buying if it comes at 930 and lower levels.
Dear Mr.Veerappan,
Nalla oru vazhi koduthu irukkeenga for buying nickel. Ungaloda lower level numberla ovvaru levelilum oru 5 lots vangalamnu irukken. mikka nandri vidadheenga nickelai.
Appuram andha mentaloil garseed ellam parandhu kittey irukku. Namba sagodara vanigargal kashtapadukirargal, konjam dayavu panni ulukki vidunga.
Nandri.
|
|
| Back to top |
|
|
sherbaaz
Yellow Belt
Joined: 27 May 2009
Posts: 543
|
| Post: #8 Posted: Wed Mar 21, 2012 9:18 am Post subject: |
|
|
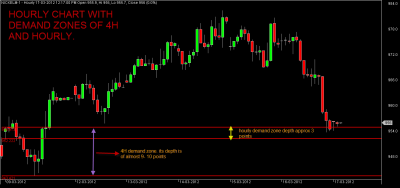
In continuation to my below mail where i attached hourly charts of nickel mini.
On hourly price broke the last demand zone as shown on hourly chart in the below attached chart. It finally took support from where the trend on 15M had started.
It almost retraced to 99% of the W.1 or W.A.
Attached is the chart of of 15M of the night session dated 20-3-12. A good up move which could be W.3 OR W.C has started on 15M
Regds,
| Description: |
|
| Filesize: |
208.97 KB |
| Viewed: |
559 Time(s) |
|
|
|
| Back to top |
|
|
sherbaaz
Yellow Belt
Joined: 27 May 2009
Posts: 543
|
| Post: #9 Posted: Wed May 02, 2012 5:20 pm Post subject: |
|
|
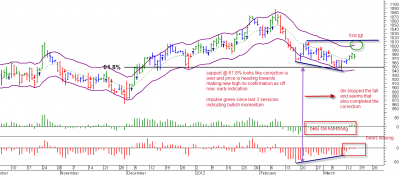
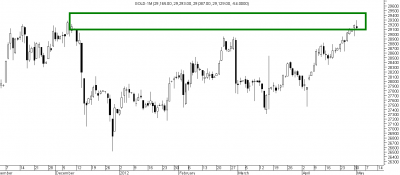
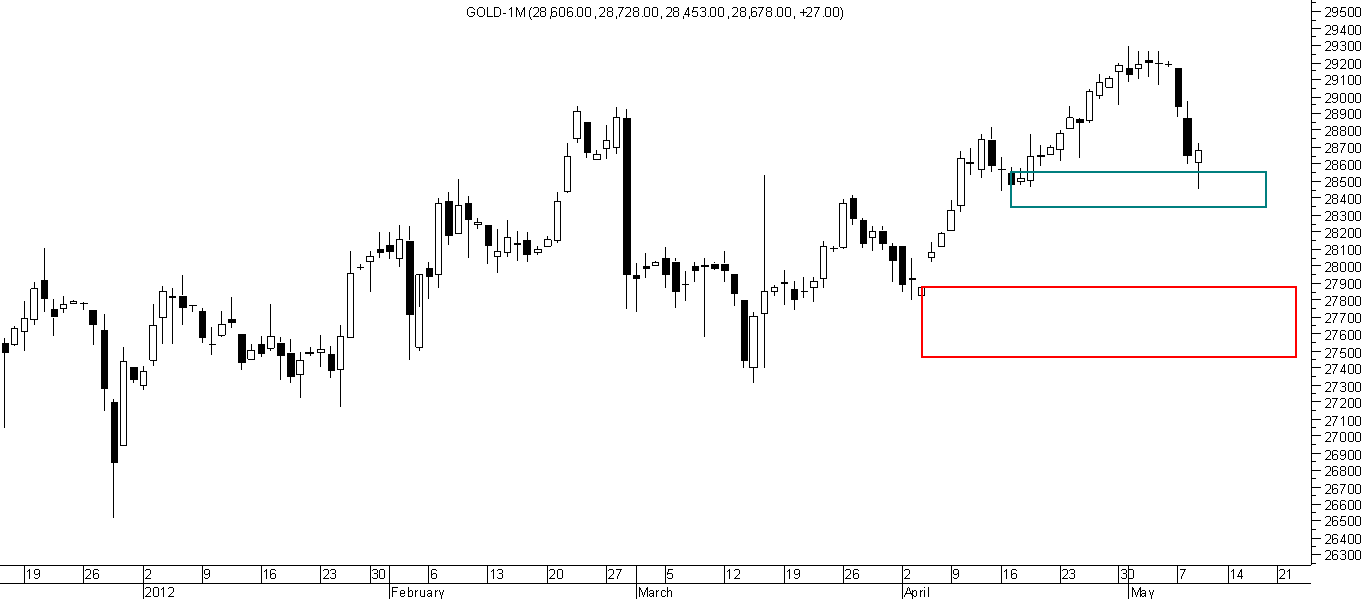
Below is the chart of GOLD 1M EOD. It has entered in a significant supply zone.
Strong demand can only take out this zone. Good place to short.
Regds,
| Description: |
|
| Filesize: |
11.81 KB |
| Viewed: |
553 Time(s) |
|
|
|
| Back to top |
|
|
umesh1
Brown Belt

Joined: 24 Nov 2008
Posts: 1974
|
| Post: #10 Posted: Wed May 02, 2012 9:23 pm Post subject: gold monthly lvls |
|
|
Sherbazz Ji
I appreciate your identification of supply zone,best area to short as stoploss also near.monthly Gann levels were buy abv 29090 and sell belo 29020,use any correction in gold as buy only till akshaye trithiye is celebrated in Asia
Cheers
Umesh Jaggasia
|
|
| Back to top |
|
|
sherbaaz
Yellow Belt
Joined: 27 May 2009
Posts: 543
|
| Post: #11 Posted: Thu May 03, 2012 9:53 pm Post subject: |
|
|
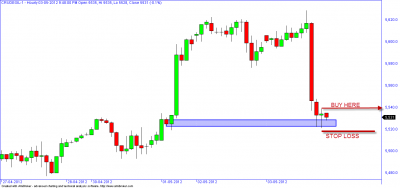
Crude oil hourly chart currently price is at imp demand zone. One can go long above the high of doji keeping sl below its low of can go long in lower time frame.
regds,
| Description: |
|
| Filesize: |
12.37 KB |
| Viewed: |
549 Time(s) |
|
|
|
| Back to top |
|
|
sherbaaz
Yellow Belt
Joined: 27 May 2009
Posts: 543
|
| Post: #12 Posted: Fri May 11, 2012 1:37 pm Post subject: |
|
|
| sherbaaz wrote: | Below is the chart of GOLD 1M EOD. It has entered in a significant supply zone.
Strong demand can only take out this zone. Good place to short.
Regds, |
gold 700-800 points down from the short level.
currently at a demand zone long can be initiated here as per individual method. if not able to sustain current support it may fall to 27850-27500 on eod basis.
regds,
| Description: |
|
| Filesize: |
11.05 KB |
| Viewed: |
2971 Time(s) |
|
|
|
| Back to top |
|
|
sherbaaz
Yellow Belt
Joined: 27 May 2009
Posts: 543
|
| Post: #13 Posted: Fri Jun 28, 2013 7:01 pm Post subject: |
|
|
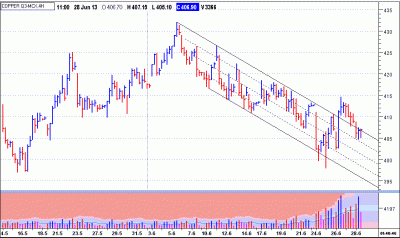
copper 4h chart looking good to go long. it looks lke that there is lots of buying happened around 400 level.
regds,
| Description: |
|
| Filesize: |
21.24 KB |
| Viewed: |
539 Time(s) |
|
|
|
| Back to top |
|
|
jpr999
White Belt
Joined: 19 May 2013
Posts: 6
|
| Post: #14 Posted: Fri Jun 28, 2013 7:32 pm Post subject: demand supply zones |
|
|
thanks for your explanation its nice. while identifying demand and supply zones, i have two questions 1. out of several tops and bottoms available how u r picking a few from them 2. r u using any higher tome frames for identifying demand and supply zones?
thanks
jpr999
|
|
| Back to top |
|
|
sherbaaz
Yellow Belt
Joined: 27 May 2009
Posts: 543
|
| Post: #15 Posted: Sat Jun 29, 2013 9:21 am Post subject: Re: demand supply zones |
|
|
| jpr999 wrote: | thanks for your explanation its nice. while identifying demand and supply zones, i have two questions 1. out of several tops and bottoms available how u r picking a few from them 2. r u using any higher tome frames for identifying demand and supply zones?
thanks
jpr999 |
answer to your second question is YES. i use multiple time frames.
answer to your first Q - is Price action reveal the things if you know how to read it. I cannot give you specific answer, i hope you understand.
regds,
|
|
| Back to top |
|
|
|


