| View previous topic :: View next topic |
| Author |
CRUDE TECHNICALS WITH CHARTS |
D0407
White Belt

Joined: 14 Jun 2013
Posts: 87
|
Post: #16  Posted: Thu May 15, 2014 1:14 pm Post subject: Posted: Thu May 15, 2014 1:14 pm Post subject: |
 |
|
| zritesh wrote: | | D0407 wrote: | | ssir how to trade this setups of price action..wht will be stopploss...i dont know anything abt price action..if u can pls guide me? |
Price action setup: We try to find out whether market is trending or market is in sideways.....
Trending market every body knows.... higher highs and higher low or lower low and lower high. basically marking swing high and low on the chart... You can read ytc price action trading books to know how to identify low and high..
google it u will find it..
Sideways market: when in uptrend if price is not able to breakout previous high then its a failed breakout and it will test the previous low... we call it BOF(breakout failure)... if it is not able to breakout the low then sideways market confirmed... same with down trend
So we trade on breakout and failed breakout .. |
what timeframe should be used while following price action><????
|
|
| Back to top |
|
 |
|
|
|
zritesh
White Belt
Joined: 03 Apr 2010
Posts: 53
|
| Post: #17 Posted: Thu May 15, 2014 2:08 pm Post subject: |
|
|
Hi D407,
I am happy at least you are trying to understand the concept... Believe me if you want to be successful in trading only price action approach will give you that kind of edge...
In last five years of my trading i tried n numbers of indicators and strategy...
But the truth is indicators are lagging, and u need to think as what smart money is doing in the market.. You will have to respect the Demand and Supply area...
Anyway i am comfortable with 15min time frame... This approch u can follow in any timeframe..
|
|
| Back to top |
|
|
amitagg
Black Belt

Joined: 01 Oct 2013
Posts: 4559
|
| Post: #18 Posted: Thu May 15, 2014 6:18 pm Post subject: |
|
|
| zritesh wrote: | Swing Highs and Lows
A swing high is simply any turning point where rising price changes to falling price. I define a swing high (SH) as a price bar high, preceded by two lower highs (LH) and followed by two lower highs (LH)
A swing low is simply any turning point where falling price changes to rising price. I define a swing low (SL) as a price bar low, preceded by two higher lows (HL) and followed by two higher lows (HL) |
this concept is similar to - called "fractal" of one famous trader......
|
|
| Back to top |
|
|
zritesh
White Belt
Joined: 03 Apr 2010
Posts: 53
|
| Post: #19 Posted: Thu May 15, 2014 6:52 pm Post subject: |
|
|
| amitagg wrote: | | zritesh wrote: | Swing Highs and Lows
A swing high is simply any turning point where rising price changes to falling price. I define a swing high (SH) as a price bar high, preceded by two lower highs (LH) and followed by two lower highs (LH)
A swing low is simply any turning point where falling price changes to rising price. I define a swing low (SL) as a price bar low, preceded by two higher lows (HL) and followed by two higher lows (HL) |
this concept is similar to - called "fractal" of one famous trader...... |
Hi Amitagg,
Concept is nothing new.. It will match to somebody in this trading world...
You go through with so many strategies and concept and come up with your own which suits ur personality..
Let me tell you, i started my trading journey with ichart in 2010.. Learnt swing trading in spec's style, viru annas levels and Ramesh raja's experience... then came across Saints flow in other forum.. And while searching studied Ytc price action by Lance beggs... This book has changed my approach towards the market.. i dont follow it completely because my style touches Specs swing and Saints flow...
Now the last but not least it is not fractal approach as while trading its not only swing but there are many things i see... Like Early reversal line, Price Flip, Demand area, Supply area, Breakout,failed breakout exectra.. I try to find out the decision points through these area where traders are not sure which way market will move.. and much more cant explain it in one day...
its pure price action nothing else...
|
|
| Back to top |
|
|
zritesh
White Belt
Joined: 03 Apr 2010
Posts: 53
|
|
| Back to top |
|
|
D0407
White Belt
Joined: 14 Jun 2013
Posts: 87
|
| Post: #21 Posted: Fri May 16, 2014 9:43 am Post subject: |
|
|
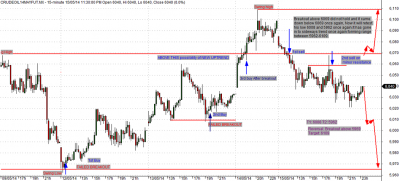
| zritesh wrote: | Chart speaks everything  |
 yea the chart is speaking. yea the chart is speaking.  grt one sir. i have doubt as u said the price below 6069 will make a downside move...does the candles have to be closed below 6069 to turn into a downard move..if yes then how many candles should be closed below 6069.sry sir i am not getting how to trade it. grt one sir. i have doubt as u said the price below 6069 will make a downside move...does the candles have to be closed below 6069 to turn into a downard move..if yes then how many candles should be closed below 6069.sry sir i am not getting how to trade it.
|
|
| Back to top |
|
|
zritesh
White Belt
Joined: 03 Apr 2010
Posts: 53
|
| Post: #22 Posted: Fri May 16, 2014 10:34 am Post subject: |
|
|
| D0407 wrote: | | zritesh wrote: | | Chart speaks everything |
yea the chart is speaking. grt one sir. i have doubt as u said the price below 6069 will make a downside move...does the candles have to be closed below 6069 to turn into a downard move..if yes then how many candles should be closed below 6069.sry sir i am not getting how to trade it. |
Hi DO407,
Yes candle should close below 6069 and the following candle should break the low+filter of the signal candle... Filter could be 6 to 7 points for valid breakout.
|
|
| Back to top |
|
|
zritesh
White Belt
Joined: 03 Apr 2010
Posts: 53
|
| Post: #23 Posted: Fri May 16, 2014 10:38 am Post subject: |
|
|
Sell was initiated yesterday and u can see the movement today... thats power of price action.. 
|
|
| Back to top |
|
|
zritesh
White Belt
Joined: 03 Apr 2010
Posts: 53
|
| Post: #24 Posted: Fri May 16, 2014 7:34 pm Post subject: |
|
|
| All targets hit as posted in the chart...
|
|
| Back to top |
|
|
D0407
White Belt
Joined: 14 Jun 2013
Posts: 87
|
| Post: #25 Posted: Fri May 16, 2014 8:16 pm Post subject: |
|
|
| zritesh wrote: | | All targets hit as posted in the chart... |
 good sir! price action is simple yet effective way of trading.sir u r trading price action from so many month how much points can we get in crude averagely.do u trade in lead too><? can u post a chartof lead showing price action setups if u can plsss...i trade in leadmini..and want to learn good sir! price action is simple yet effective way of trading.sir u r trading price action from so many month how much points can we get in crude averagely.do u trade in lead too><? can u post a chartof lead showing price action setups if u can plsss...i trade in leadmini..and want to learn
|
|
| Back to top |
|
|
zritesh
White Belt
Joined: 03 Apr 2010
Posts: 53
|
| Post: #26 Posted: Fri May 16, 2014 8:32 pm Post subject: |
|
|
| D0407 wrote: | | zritesh wrote: | | All targets hit as posted in the chart... |
good sir! price action is simple yet effective way of trading.sir u r trading price action from so many month how much points can we get in crude averagely.do u trade in lead too><? can u post a chartof lead showing price action setups if u can plsss...i trade in leadmini..and want to learn |
You will earn sufficient point more then ur salary... will try to post leadmini chart..
|
|
| Back to top |
|
|
dine
White Belt
Joined: 11 Jul 2009
Posts: 73
|
| Post: #27 Posted: Sat May 17, 2014 6:15 pm Post subject: |
|
|
| zritesh wrote: | | D0407 wrote: | | ssir how to trade this setups of price action..wht will be stopploss...i dont know anything abt price action..if u can pls guide me? |
Price action setup: We try to find out whether market is trending or market is in sideways.....
Trending market every body knows.... higher highs and higher low or lower low and lower high. basically marking swing high and low on the chart... You can read ytc price action trading books to know how to identify low and high..
google it u will find it..
Sideways market: when in uptrend if price is not able to breakout previous high then its a failed breakout and it will test the previous low... we call it BOF(breakout failure)... if it is not able to breakout the low then sideways market confirmed... same with down trend
So we trade on breakout and failed breakout .. |
Do you mind sharing the link to YTC PAT book ? I have gone through vol 1 &2 . It was a good read. I dont have rest of the volumes.
Regards,
Dinesh S.
|
|
| Back to top |
|
|
zritesh
White Belt
Joined: 03 Apr 2010
Posts: 53
|
| Post: #28 Posted: Sat May 17, 2014 7:41 pm Post subject: |
|
|
| dine wrote: | | zritesh wrote: | | D0407 wrote: | | ssir how to trade this setups of price action..wht will be stopploss...i dont know anything abt price action..if u can pls guide me? |
Price action setup: We try to find out whether market is trending or market is in sideways.....
Trending market every body knows.... higher highs and higher low or lower low and lower high. basically marking swing high and low on the chart... You can read ytc price action trading books to know how to identify low and high..
google it u will find it..
Sideways market: when in uptrend if price is not able to breakout previous high then its a failed breakout and it will test the previous low... we call it BOF(breakout failure)... if it is not able to breakout the low then sideways market confirmed... same with down trend
So we trade on breakout and failed breakout .. |
Do you mind sharing the link to YTC PAT book ? I have gone through vol 1 &2 . It was a good read. I dont have rest of the volumes.
Regards,
Dinesh S. |
try in 4shared.. u will find it
|
|
| Back to top |
|
|
dine
White Belt
Joined: 11 Jul 2009
Posts: 73
|
| Post: #29 Posted: Sat May 17, 2014 9:38 pm Post subject: |
|
|
| Thanks for replying. But I could find only the vol 2 of it. Do you mind sharing the link as a PM ?
|
|
| Back to top |
|
|
zritesh
White Belt
Joined: 03 Apr 2010
Posts: 53
|
| Post: #30 Posted: Sat May 17, 2014 10:22 pm Post subject: |
|
|
| dine wrote: | | Thanks for replying. But I could find only the vol 2 of it. Do you mind sharing the link as a PM ? |
Can i attach it here... need permission from admin.. i have all volumes
|
|
| Back to top |
|
|
|