| View previous topic :: View next topic |
| Author |
CRUDE TECHNICALS WITH CHARTS |
iakash
White Belt

Joined: 07 Mar 2012
Posts: 46
|
Post: #46  Posted: Tue May 20, 2014 11:37 am Post subject: Posted: Tue May 20, 2014 11:37 am Post subject: |
 |
|
Hi zritesh,
I have been following crude oil movement for the past few months. Just like you, after studying a lot of indicators, I finally moved to price action. I currently use a stgy which exploits big BO or BOF moves in a trending market on EOD charts. But I have to sit out most of the time when the market is range bound. Thanks for explaining here a method of how one can use BO and BOF on a lower TF, to exploit range bound periods.
I would like to learn more on price action. You have mentioned of YTC books that are available online. Can you PM me the links for these books.
Thanks.
|
|
| Back to top |
|
 |
|
|
|
zritesh
White Belt
Joined: 03 Apr 2010
Posts: 53
|
| Post: #47 Posted: Tue May 20, 2014 2:51 pm Post subject: |
|
|
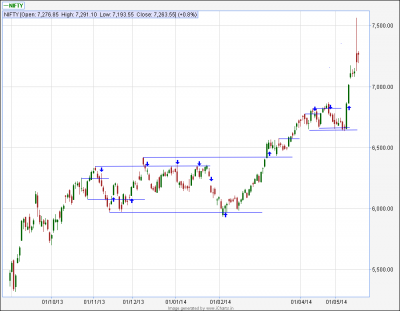
Nifty EOD charts with possible trades... You need to understand few candle patterns to trade with price action on eod charts...
For example: on election day candle... its a thrust bar which made a high but close in red.. which is a warning for buyers that may be sellers are equally strong at this level
| Description: |
|
| Filesize: |
18.24 KB |
| Viewed: |
705 Time(s) |
|
|
|
| Back to top |
|
|
zritesh
White Belt
Joined: 03 Apr 2010
Posts: 53
|
| Post: #48 Posted: Tue May 20, 2014 6:15 pm Post subject: |
|
|
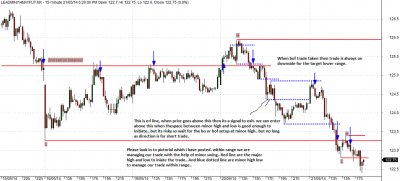
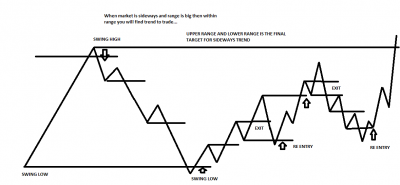
Today we will go ahead little deeper on price action strategy:
* will discuss how to re entry and exit...
*Erl(early reversal line) concept...
* How we can manage our trade intraday...
Wait for close of commodity market ...
|
|
| Back to top |
|
|
zritesh
White Belt
Joined: 03 Apr 2010
Posts: 53
|
| Post: #49 Posted: Tue May 20, 2014 6:41 pm Post subject: |
|
|
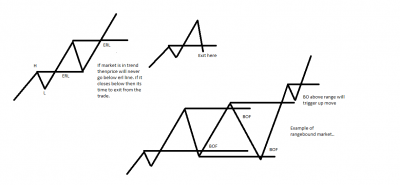
Basic concept of erl and price action
| Description: |
|
| Filesize: |
26.71 KB |
| Viewed: |
938 Time(s) |
|
| Description: |
|
| Filesize: |
24.67 KB |
| Viewed: |
890 Time(s) |
|
|
|
| Back to top |
|
|
zritesh
White Belt
Joined: 03 Apr 2010
Posts: 53
|
| Post: #50 Posted: Wed May 21, 2014 12:47 am Post subject: |
|
|
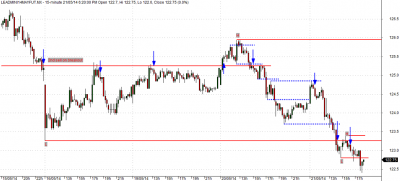
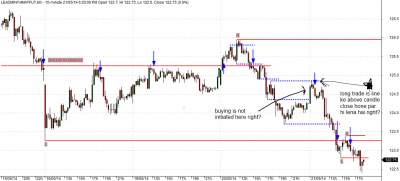
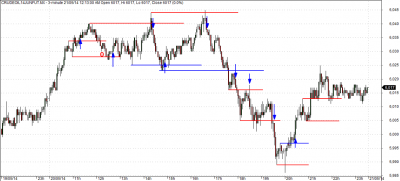
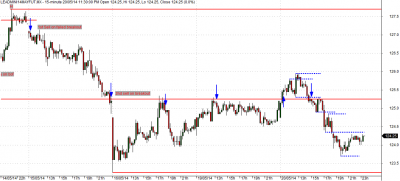
Crude trade on 3 min time frame and leadmini in 15 min timeframe
| Description: |
|
| Filesize: |
88.34 KB |
| Viewed: |
801 Time(s) |
|
| Description: |
|
| Filesize: |
95.39 KB |
| Viewed: |
716 Time(s) |
|
|
|
| Back to top |
|
|
welgro
Brown Belt

Joined: 24 Sep 2012
Posts: 1784
|
| Post: #51 Posted: Wed May 21, 2014 9:56 am Post subject: |
|
|
| zritesh wrote: | | Basic concept of erl and price action |
Thanks zritesh..For updating price action range definition chart...
~~~~~~~~~~~~~~~~~~~~~~~~~~~~~~~~~~~
Merrill�s patterns
Sometimes it’s good to go back to basics. Arthur Merrill, the author of Behavior of Prices on Wall Street, compared the market to a warped roulette wheel. It has a bias and often tips its hand. One way it does this is graphical, in the relation of swing legs to one another.
John Bollinger brought Merrill to the attention of the online world some years ago when he posted Merrill’s 16 W and 16 M patterns. These patterns, of course, all have four legs, but they differ in their message to traders. They’re a one-page Cliff Notes for pattern traders.
Merrill’s Categorization of M and W Patterns
Technical Patterns Merrill’s Patterns
Uptrends M15,M16,W14,W16
Downtrends M1,M3,W1,W2
Head and shoulders W6,W7,W9,W11,W13,W15
Inverted head and shoulders M2,M4,M6,M8,M10,M11
Triangle M13,W4
Broadening M5,W12
-------------------------------------------------
DOWNLOAD M W PATTERNS EBOOK....
M&W WAVE PATTERNS - Arthuer A. Merrill - 1980
| Description: |
|

Download |
| Filename: |
M&W WAVE PATTERNS - MORE DATA - Arthuer A. Merrill - 1984.pdf |
| Filesize: |
243.81 KB |
| Downloaded: |
3817 Time(s) |
|
|
| Back to top |
|
|
zritesh
White Belt
Joined: 03 Apr 2010
Posts: 53
|
| Post: #52 Posted: Wed May 21, 2014 12:38 pm Post subject: |
|
|
Thanks for the input welgro... it feels nice when i see somebody is using price action for the trade...
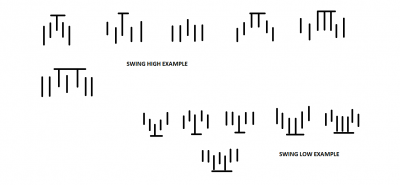
Now next thing is how to identify the swing high and low.. although i have given the definition for swing in my previous post.. now lets do it once again with the help of pictorial presentation..
Definition:
Swing Highs and Lows
A swing high is simply any turning point where rising price changes to falling price. I define a swing high (SH) as a price bar high, preceded by two lower highs (LH) and followed by two lower highs (LH)
A swing low is simply any turning point where falling price changes to rising price. I define a swing low (SL) as a price bar low, preceded by two higher lows (HL) and followed by two higher lows (HL)
I hope members of icharts is finding it useful...
| Description: |
|
| Filesize: |
21.17 KB |
| Viewed: |
794 Time(s) |

|
|
|
| Back to top |
|
|
zritesh
White Belt
Joined: 03 Apr 2010
Posts: 53
|
| Post: #53 Posted: Wed May 21, 2014 6:05 pm Post subject: |
|
|
Look at lead mini.. nothing can beat price action.. no matter if market is sideways or trending, you are always in the right side.. 
|
|
| Back to top |
|
|
D0407
White Belt
Joined: 14 Jun 2013
Posts: 87
|
| Post: #54 Posted: Wed May 21, 2014 6:15 pm Post subject: |
|
|
| zritesh wrote: | | Look at lead mini.. nothing can beat price action.. no matter if market is sideways or trending, you are always in the right side.. |
 nice sir.. leadmini can u post chart pls...lol..i am making many mistakes while drawing the lines..it will take tme to understand and learn how to draw accurately like u nice sir.. leadmini can u post chart pls...lol..i am making many mistakes while drawing the lines..it will take tme to understand and learn how to draw accurately like u 
|
|
| Back to top |
|
|
zritesh
White Belt
Joined: 03 Apr 2010
Posts: 53
|
|
| Back to top |
|
|
D0407
White Belt
Joined: 14 Jun 2013
Posts: 87
|
|
| Back to top |
|
|
zritesh
White Belt
Joined: 03 Apr 2010
Posts: 53
|
|
| Back to top |
|
|
amit0666
White Belt
Joined: 23 Jun 2010
Posts: 86
|
| Post: #58 Posted: Wed May 21, 2014 11:33 pm Post subject: |
|
|
| thank you for posting nifty eod chart sir whenever time permits plz post more eod charts and also plz post study material thank you ---amit
|
|
| Back to top |
|
|
welgro
Brown Belt
Joined: 24 Sep 2012
Posts: 1784
|
| Post: #59 Posted: Thu May 22, 2014 9:13 am Post subject: |
|
|
| zritesh wrote: | Thanks for the input welgro... it feels nice when i see somebody is using price action for the trade..
I hope members of icharts is finding it useful...
|
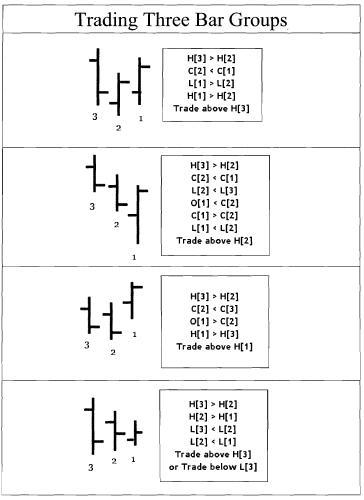
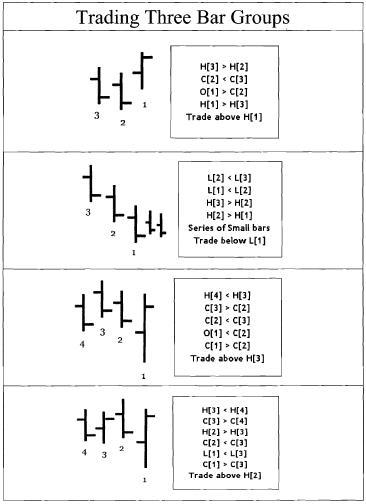
Three Bar Groups
Chart formations in Technical analysis require a group of bars to derive a pattern. Sometimes a single bar or two bars can show great patterns, but as a group, 3-bar series groups provide reliable patterns or confirmations for other major developing patterns. These groups of bars are called "key reversal" bars. This 3-bar group may also consist of well known two-bar
reversals or a single bar patterns within inside this group. Most of these 3-bar groups are partof a "fractal" formations or part of "market structures" where a prevailing trend showing signs of pausing or reversal of current trends. Bars with exhaustion price-action, "narrow range (with inside-days)" or "spike with ledges" are some of the 3-bar group pattern examples. 3-bar
group pattern formations near key support and resistance levels or near key moving averages I (50 EMA, 200 SMA) offer great potential trade setups.
Within the 3-Bar Groups, intra-bar relations like close and open values relative to other bar , close and open values and how they are formed could give signals of continuation or reversal of trends. Gaps within the 3-bar patterns also have significance.
Three Bar Pattern groups as the name suggests, will have three continuous bars. It can be in any time-frame or in any market instrument. A 3-bar group pattern is defined using the three bar's inter-bar Open, High, Low, Close relationships with each other. In my view, Three Bar patterns are relatively short trade setups and should be traded using other indicators. They are
more effective as reversals near the end of prolonged trends than in the middle of the trends. When markets making new highs and showing a series of signs of pausing or reversals, 3-bar patterns are more reliable than 3-bars formed in the middle of the trend. Two out of three 3- Bar Groups may be successful but the concept also applies to bigger structures with three
continuous major "swing highs" and three continuous major "swing lows". When trading three-bar groups, look for the third bars' range. When the range of the third bar is greater than prior two bars, it tends to produce more reliable results.
One of the 3-Bar Groups (Market Structures) is discussed in detail in this book and here I
present few of my favorite patterns that 1 trade.
Trading 3-Bar Groups
All the 3-Bar group patterns listed below have trade-setups. Most of these patterns are shortterm
based and targets are usually at a major "swing high or major "swing low" based on the
pattern setup. Stop orders should be placed to protect the trade within the 3-bar groups. Three
bar group patterns fail when significant support or resistance is traded against the trade setup.
When trading an upside 3-bar group, place a stop order below the lowest low of the three bars.
When trading a downside 3-bar group, place a stop order above the highest high of the three bars.
|
|
| Back to top |
|
|
Allwell
White Belt
Joined: 24 Jan 2010
Posts: 183
|
| Post: #60 Posted: Thu May 22, 2014 2:57 pm Post subject: Tata Steel chart |
|
|
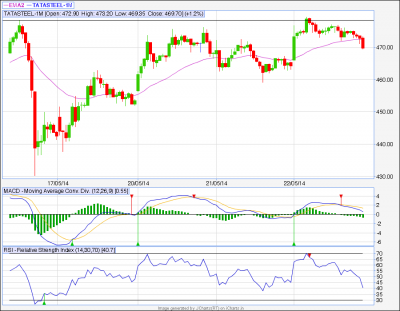
Hi, Zritesh..
Attached here Tata Steel Fut. charts....seems breakout fail...your view please
(Allwell)
| Description: |
|
| Filesize: |
33.63 KB |
| Viewed: |
637 Time(s) |
|
|
|
| Back to top |
|
|
|