| View previous topic :: View next topic |
| Author |
CRUDE TECHNICALS WITH CHARTS |
jacky75
White Belt

Joined: 19 Feb 2012
Posts: 47
|
Post: #76  Posted: Fri May 23, 2014 2:46 pm Post subject: Posted: Fri May 23, 2014 2:46 pm Post subject: |
 |
|
zritesh
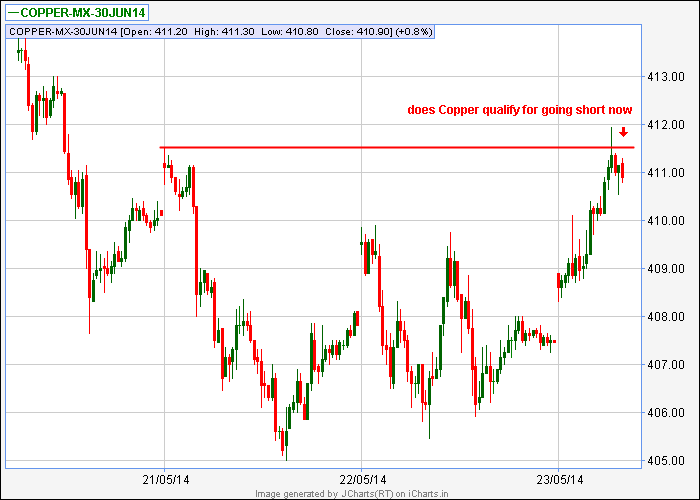
could you check copper chart and confirm if this is a valid short entry point ?
pls also check pm
| Description: |
|
| Filesize: |
10.5 KB |
| Viewed: |
2650 Time(s) |
|
|
|
| Back to top |
|
 |
|
|
|
zritesh
White Belt
Joined: 03 Apr 2010
Posts: 53
|
| Post: #77 Posted: Fri May 23, 2014 3:24 pm Post subject: |
|
|
| jacky75 wrote: | zritesh
could you check copper chart and confirm if this is a valid short entry point ?
pls also check pm |
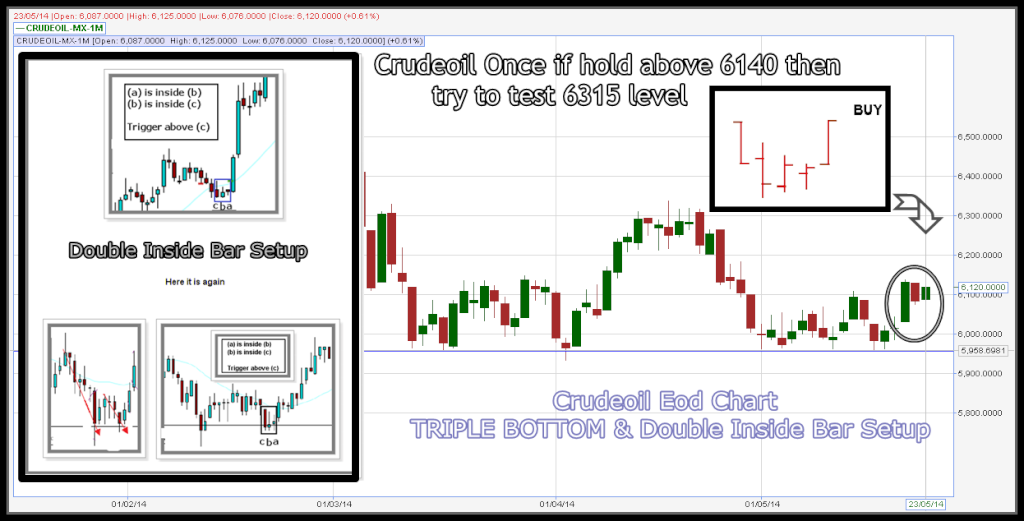
First try to put swing high and low on ur chart.. then look for BO and BOF trade... dont look at historical high or low for the setup.. its the present high low... Historical high or low is ment to be broken... Posting copper chart.. currently there is no BOF... The Bof which u r showing is dependent on historical level and that is only to book partial profit.. as market tends to stop at this level for further move...
| Description: |
|
| Filesize: |
103.21 KB |
| Viewed: |
733 Time(s) |
|
|
|
| Back to top |
|
|
jacky75
White Belt
Joined: 19 Feb 2012
Posts: 47
|
| Post: #78 Posted: Fri May 23, 2014 3:30 pm Post subject: |
|
|
| thanx for prompt and detailed reply
|
|
| Back to top |
|
|
amit0666
White Belt
Joined: 23 Jun 2010
Posts: 86
|
| Post: #79 Posted: Sat May 24, 2014 8:51 am Post subject: |
|
|
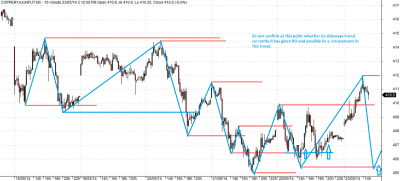
plz check this sir
| Description: |
|
| Filesize: |
31.1 KB |
| Viewed: |
596 Time(s) |
|
|
|
| Back to top |
|
|
welgro
Brown Belt

Joined: 24 Sep 2012
Posts: 1784
|
| Post: #80 Posted: Sat May 24, 2014 1:02 pm Post subject: |
|
|
|
|
| Back to top |
|
|
amit0666
White Belt
Joined: 23 Jun 2010
Posts: 86
|
|
| Back to top |
|
|
zritesh
White Belt
Joined: 03 Apr 2010
Posts: 53
|
| Post: #82 Posted: Mon May 26, 2014 11:14 am Post subject: |
|
|
Friends, I will be out of station for some time.. will be back on 20th June..
Hope people will carry this thread and will post charts with their studies..
Will open a new thread on intraday trading with price action very soon...
till then keep practising.. 
|
|
| Back to top |
|
|
welgro
Brown Belt
Joined: 24 Sep 2012
Posts: 1784
|
| Post: #83 Posted: Mon May 26, 2014 11:21 am Post subject: |
|
|
| Crude Oil prices down in Asia on Monday before a holiday in the U.S
|
|
| Back to top |
|
|
zritesh
White Belt
Joined: 03 Apr 2010
Posts: 53
|
| Post: #84 Posted: Mon Jun 09, 2014 5:12 pm Post subject: |
|
|
Nobody posted a single chart in my absence....... 
|
|
| Back to top |
|
|
SFP
White Belt
Joined: 08 Feb 2010
Posts: 19
|
| Post: #85 Posted: Thu Jul 17, 2014 12:45 pm Post subject: IS NF BOF? |
|
|
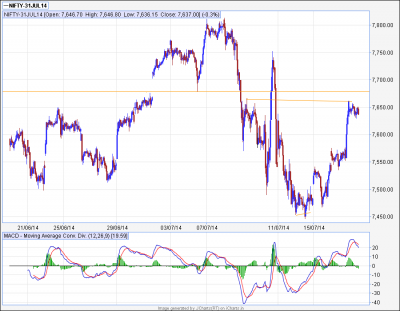
DEAR ZRITESH,
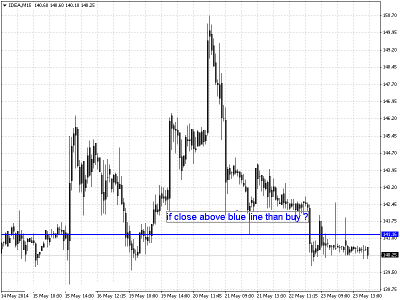
IS NF 15 TF BOF?KINDLY CONFIRM.
| Description: |
|
| Filesize: |
32.76 KB |
| Viewed: |
632 Time(s) |
|
|
|
| Back to top |
|
|
SFP
White Belt
Joined: 08 Feb 2010
Posts: 19
|
| Post: #86 Posted: Wed May 06, 2015 9:20 pm Post subject: |
|
|
D0407 wrote:
zritesh wrote:
Chart speaks everything
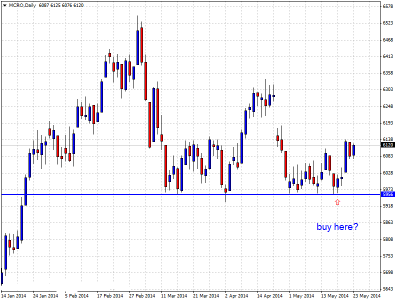
yea the chart is speaking. Very Happy grt one sir. i have doubt as u said the price below 6069 will make a downside move...does the candles have to be closed below 6069 to turn into a downard move..if yes then how many candles should be closed below 6069.sry sir i am not getting how to trade it.
Hi DO407,
Yes candle should close below 6069 and the following candle should break the low+filter of the signal candle... Filter could be 6 to 7 points for valid breakout
sir which is filter candle& signal candle please clarify?.
|
|
| Back to top |
|
|
|