| View previous topic :: View next topic |
| Author |
CRUDE TECHNICALS WITH CHARTS |
zritesh
White Belt

Joined: 03 Apr 2010
Posts: 53
|
Post: #1  Posted: Sun May 11, 2014 6:09 pm Post subject: CRUDE TECHNICALS WITH CHARTS Posted: Sun May 11, 2014 6:09 pm Post subject: CRUDE TECHNICALS WITH CHARTS |
 |
|
Dear All,
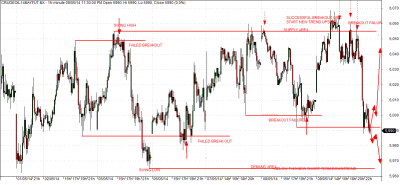
I will try to post Crude charts and my studies and trades... Hope people will like it..
[Content Edited by Admin]
| Description: |
|
| Filesize: |
36.93 KB |
| Viewed: |
833 Time(s) |
|
|
|
| Back to top |
|
 |
|
|
|
hemant.icharts
Site Admin
Joined: 10 May 2011
Posts: 334
|
| Post: #2 Posted: Mon May 12, 2014 9:00 am Post subject: Re: CRUDE TECHNICALS WITH CHARTS |
|
|
Dear Member,
Charts from external sources (other websites, softwares etc) should not have the source indicated on the charts (website/software names must not be visible on the chart).
Please abide by rules and regulation of forum.
Regards,
Hemant@iCharts.
| zritesh wrote: | Dear All,
I will try to post Crude charts and my studies and trades... Hope people will like it.. |
|
|
| Back to top |
|
|
zritesh
White Belt
Joined: 03 Apr 2010
Posts: 53
|
| Post: #3 Posted: Mon May 12, 2014 10:27 am Post subject: Re: CRUDE TECHNICALS WITH CHARTS |
|
|
| hemant.icharts wrote: | Dear Member,
Charts from external sources (other websites, softwares etc) should not have the source indicated on the charts (website/software names must not be visible on the chart).
Please abide by rules and regulation of forum.
Regards,
Hemant@iCharts.
| zritesh wrote: | Dear All,
I will try to post Crude charts and my studies and trades... Hope people will like it.. |
|
I apologise...But plz tell me how to remove the name..
|
|
| Back to top |
|
|
hemant.icharts
Site Admin
Joined: 10 May 2011
Posts: 334
|
| Post: #4 Posted: Mon May 12, 2014 10:35 am Post subject: Re: CRUDE TECHNICALS WITH CHARTS |
|
|
| zritesh wrote: | | hemant.icharts wrote: | Dear Member,
Charts from external sources (other websites, softwares etc) should not have the source indicated on the charts (website/software names must not be visible on the chart).
Please abide by rules and regulation of forum.
Regards,
Hemant@iCharts.
| zritesh wrote: | Dear All,
I will try to post Crude charts and my studies and trades... Hope people will like it.. |
|
I apologise...But plz tell me how to remove the name.. |
Dear Member,
Just open the chart in paint and select the area on which name is written and cut it.
Regards
Hemant @ iCharts.
|
|
| Back to top |
|
|
welgro
Brown Belt

Joined: 24 Sep 2012
Posts: 1784
|
| Post: #5 Posted: Mon May 12, 2014 11:06 am Post subject: Re: CRUDE TECHNICALS WITH CHARTS |
|
|
| zritesh wrote: | | hemant.icharts wrote: | Dear Member,
Charts from external sources (other websites, softwares etc) should not have the source indicated on the charts (website/software names must not be visible on the chart).
Please abide by rules and regulation of forum.
Regards,
Hemant@iCharts.
| zritesh wrote: | Dear All,
I will try to post Crude charts and my studies and trades... Hope people will like it.. |
|
I apologise...But plz tell me how to remove the name.. |
Dear zritesh,
Use easy capture for capture image...(Capture window/object)
Download link :- http://easycapture.en.softonic.com/

|
|
| Back to top |
|
|
zritesh
White Belt
Joined: 03 Apr 2010
Posts: 53
|
| Post: #6 Posted: Mon May 12, 2014 11:46 pm Post subject: |
|
|
Crude chart studies and trades for 12/5/14
| Description: |
|
| Filesize: |
51.33 KB |
| Viewed: |
783 Time(s) |
|
|
|
| Back to top |
|
|
zritesh
White Belt
Joined: 03 Apr 2010
Posts: 53
|
| Post: #7 Posted: Mon May 12, 2014 11:51 pm Post subject: |
|
|
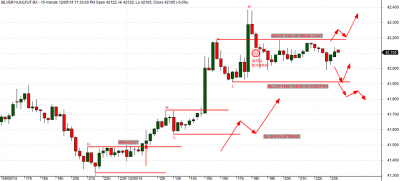
Silver Chart
| Description: |
|
| Filesize: |
84.03 KB |
| Viewed: |
753 Time(s) |
|
|
|
| Back to top |
|
|
zritesh
White Belt
Joined: 03 Apr 2010
Posts: 53
|
| Post: #8 Posted: Mon May 12, 2014 11:54 pm Post subject: |
|
|
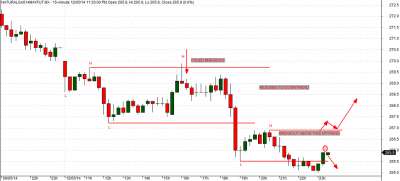
Natural gas chart
| Description: |
|
| Filesize: |
71.23 KB |
| Viewed: |
734 Time(s) |
|
|
|
| Back to top |
|
|
zritesh
White Belt
Joined: 03 Apr 2010
Posts: 53
|
| Post: #9 Posted: Wed May 14, 2014 3:40 pm Post subject: |
|
|
Crude expected movement for the day
| Description: |
|
| Filesize: |
112.82 KB |
| Viewed: |
734 Time(s) |
|
|
|
| Back to top |
|
|
zritesh
White Belt
Joined: 03 Apr 2010
Posts: 53
|
| Post: #10 Posted: Wed May 14, 2014 4:11 pm Post subject: |
|
|
Friends,
Needs to know if somebody is following my charts otherwise no use for me to post everyday...
My charts only follows price action trading approach, without any indicator...
I believe indicators work only in trending market while if u understand price action you can trade any market..
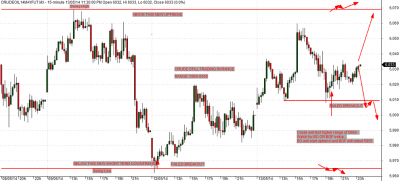
My trades are shown in the chart.. watch arrows in crude chart.. when crude tried to break his low of 5965... BOF trade done and i was able to buy at low price... 2nd buy hasbeen done when it gave BOF setup at minor support...
need ur feedback
|
|
| Back to top |
|
|
D0407
White Belt
Joined: 14 Jun 2013
Posts: 87
|
| Post: #11 Posted: Wed May 14, 2014 6:30 pm Post subject: |
|
|
| ssir how to trade this setups of price action..wht will be stopploss...i dont know anything abt price action..if u can pls guide me?
|
|
| Back to top |
|
|
zritesh
White Belt
Joined: 03 Apr 2010
Posts: 53
|
| Post: #12 Posted: Wed May 14, 2014 6:53 pm Post subject: |
|
|
| D0407 wrote: | | ssir how to trade this setups of price action..wht will be stopploss...i dont know anything abt price action..if u can pls guide me? |
Price action setup: We try to find out whether market is trending or market is in sideways.....
Trending market every body knows.... higher highs and higher low or lower low and lower high. basically marking swing high and low on the chart... You can read ytc price action trading books to know how to identify low and high..
google it u will find it..
Sideways market: when in uptrend if price is not able to breakout previous high then its a failed breakout and it will test the previous low... we call it BOF(breakout failure)... if it is not able to breakout the low then sideways market confirmed... same with down trend
So we trade on breakout and failed breakout ..
|
|
| Back to top |
|
|
zritesh
White Belt
Joined: 03 Apr 2010
Posts: 53
|
| Post: #13 Posted: Wed May 14, 2014 7:09 pm Post subject: |
|
|
Swing Highs and Lows
A swing high is simply any turning point where rising price changes to falling price. I define a swing high (SH) as a price bar high, preceded by two lower highs (LH) and followed by two lower highs (LH)
A swing low is simply any turning point where falling price changes to rising price. I define a swing low (SL) as a price bar low, preceded by two higher lows (HL) and followed by two higher lows (HL)
|
|
| Back to top |
|
|
zritesh
White Belt
Joined: 03 Apr 2010
Posts: 53
|
| Post: #14 Posted: Wed May 14, 2014 11:48 pm Post subject: |
|
|
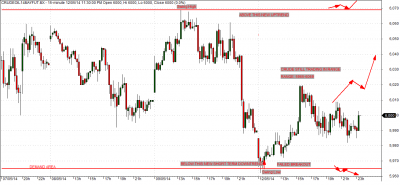
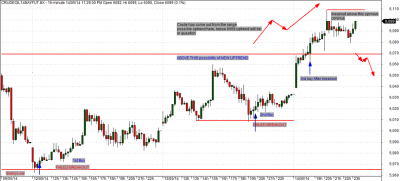
As my previous chart shown that breakout above 6069 will trigger possible up move... there was three times buying opportunity were available if someone would have followed the study...
posting once again for possible up move for tomorrow
| Description: |
|
| Filesize: |
132.98 KB |
| Viewed: |
739 Time(s) |
|
|
|
| Back to top |
|
|
D0407
White Belt
Joined: 14 Jun 2013
Posts: 87
|
| Post: #15 Posted: Thu May 15, 2014 1:10 pm Post subject: |
|
|
| zritesh wrote: | Swing Highs and Lows
A swing high is simply any turning point where rising price changes to falling price. I define a swing high (SH) as a price bar high, preceded by two lower highs (LH) and followed by two lower highs (LH)
A swing low is simply any turning point where falling price changes to rising price. I define a swing low (SL) as a price bar low, preceded by two higher lows (HL) and followed by two higher lows (HL) |
thank u sir for the knowledge...i think it will take tme for me to learn these concepts.i will follow you...sir i couldnt find that ytc price action book...i found ytc scalper...so going to read it.
|
|
| Back to top |
|
|
|


