| View previous topic :: View next topic |
| Author |
Crudeoil Positional Analysis ~ Welgro Corner |
welgro
Brown Belt

Joined: 24 Sep 2012
Posts: 1784
|
Post: #256  Posted: Mon Dec 01, 2014 8:55 pm Post subject: Posted: Mon Dec 01, 2014 8:55 pm Post subject: |
 |
|

|
|
| Back to top |
|
 |
|
|
 |
welgro
Brown Belt

Joined: 24 Sep 2012
Posts: 1784
|
Post: #257  Posted: Tue Dec 02, 2014 7:17 am Post subject: Posted: Tue Dec 02, 2014 7:17 am Post subject: |
 |
|
|
|
| Back to top |
|
 |
rj82
White Belt

Joined: 17 Jul 2014
Posts: 11
|
Post: #258  Posted: Tue Dec 02, 2014 9:35 am Post subject: Posted: Tue Dec 02, 2014 9:35 am Post subject: |
 |
|
| welgro wrote: |  |
Hello Welgro,
there will be V pattern activated in 4 hr chart of crude oil above 69.6 --- with a length of 6$, am i reading right could you see & confirm.. thanks, tried to maintain the sebi norms....... (' ') ')
|
|
| Back to top |
|
 |
welgro
Brown Belt

Joined: 24 Sep 2012
Posts: 1784
|
Post: #259  Posted: Wed Dec 03, 2014 10:37 am Post subject: Posted: Wed Dec 03, 2014 10:37 am Post subject: |
 |
|
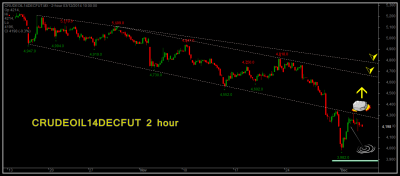
CRUDEOIL14DECFUT
| Description: |
|
| Filesize: |
50.94 KB |
| Viewed: |
418 Time(s) |
|
|
|
| Back to top |
|
 |
welgro
Brown Belt

Joined: 24 Sep 2012
Posts: 1784
|
Post: #260  Posted: Thu Dec 04, 2014 8:38 am Post subject: Posted: Thu Dec 04, 2014 8:38 am Post subject: |
 |
|
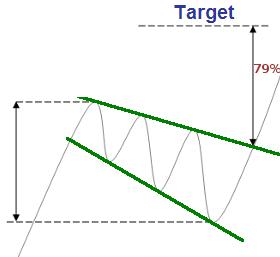
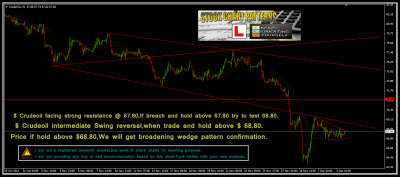
Descending broadening wedge
Descending broadening wedges are continuation chart patterns formed by a channel that widens and is against the trend. Forex volumes tend to increase during the formation of such a wedge.
A break through the resistance line provides a good signal to trade into a continuation of the trend with a price target equal to the height that separates the pattern's high and low.
http://www.forex-central.net/chart-patterns/broadening-wedges.php

| Description: |
|
| Filesize: |
8.79 KB |
| Viewed: |
1776 Time(s) |
|
| Description: |
|
| Filesize: |
186.08 KB |
| Viewed: |
398 Time(s) |
|
|
|
| Back to top |
|
 |
welgro
Brown Belt

Joined: 24 Sep 2012
Posts: 1784
|
|
| Back to top |
|
 |
welgro
Brown Belt

Joined: 24 Sep 2012
Posts: 1784
|
Post: #262  Posted: Thu Dec 04, 2014 5:15 pm Post subject: Posted: Thu Dec 04, 2014 5:15 pm Post subject: |
 |
|
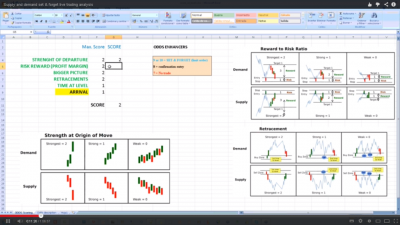
Price action is how price moved the way it did. It is what you see on a chart.
Supply Demand is what the reason behind price action to do what it did.
In short supply demand zones form the origin of price beginning its journey up or down.
Clever traders buy where they buy-or sell where they sell and they stay ahead of price action by understanding and applying price action causes and effects ahead of its happening.
The video here helps getting it.
What odds favour supply demand shifts?
see ODDS ENHANCERS picture
http://www.youtube.com/watch?v=Um5gDT7whcI
| Description: |
|
| Filesize: |
283.04 KB |
| Viewed: |
443 Time(s) |
|
| Description: |
|
| Filesize: |
104.85 KB |
| Viewed: |
522 Time(s) |
|
|
|
| Back to top |
|
 |
welgro
Brown Belt

Joined: 24 Sep 2012
Posts: 1784
|
Post: #263  Posted: Thu Dec 04, 2014 9:01 pm Post subject: Posted: Thu Dec 04, 2014 9:01 pm Post subject: |
 |
|
Why traders don’t appreciate the value of these patterns
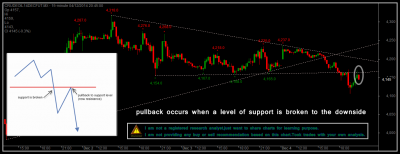
Having your price bouncing off that support/resistance level, is a great way of confirming the breakout. That works well for the patient trader who waits for this pullback. However, what happens more often is this …
Too often, these pullbacks and throwbacks become the bane of a trader’s life.
There is no reason for this to happen – as with most things in life, if we understand what can happen, and why it happens – we’re automatically ahead of the game.
Normally a throwback will occur when there is a high-volume breakout. Following that break, it is usual for the momentum to wane, resulting in the retracement that we see in these patterns.
Only then does the price resume the direction started by the breakout.
A neat bounce off this line will give us a clear entry level. However, as we’ll discuss in a moment – the bounce isn’t always as tidy as those in the diagrams above.
http://www.tradersbulletin.co.uk/how-to-double-your-money-when-the-price-goes-the-wrong-way
| Description: |
|
| Filesize: |
79.32 KB |
| Viewed: |
389 Time(s) |
|
|
|
| Back to top |
|
 |
welgro
Brown Belt

Joined: 24 Sep 2012
Posts: 1784
|
Post: #264  Posted: Fri Dec 05, 2014 9:22 am Post subject: Posted: Fri Dec 05, 2014 9:22 am Post subject: |
 |
|
Trend Trades Definitions

Definition of Trend
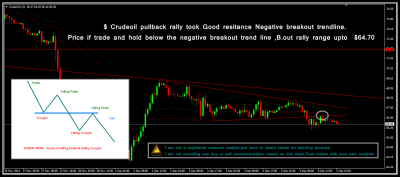
We defined UP trend as a series of rising troughs and rising peaks in higher time frames. To identify, UP trend, we first identify troughs, but to say it is UP trend, we need to see 'rising troughs and rising peaks'.
We defined DOWN trend as a series of falling peaks and falling troughs in higher time frames. To identify downtrend, we first look at peaks but to say it is downtrend, we need to see 'falling peaks & falling troughs'.
Definition of FLIP.
In uptrend resistance can change role as support & vice versa. This is what we call FLIP. After breaks, price will make a new high in uptrend (rising peaks) or a new low in down trend (falling troughs'. Once price start to retrace, we will wait for price action within +50 to -50 from FLIP Line. We want to see First Swing Point.
In higher time frames - we identify trend using trend definition. Next question, where the FLIP? In uptrend - the flip means at higher low & in DOWN trend the flip mean at lower high. And the Flip zone is within +50 & -50 from FLIP Line.
http://nakedtrading.blogspot.in/2011/04/trend-trades-definitions.html
| Description: |
|
| Filesize: |
84.88 KB |
| Viewed: |
401 Time(s) |
|
|
|
| Back to top |
|
 |
welgro
Brown Belt

Joined: 24 Sep 2012
Posts: 1784
|
|
| Back to top |
|
 |
welgro
Brown Belt

Joined: 24 Sep 2012
Posts: 1784
|
|
| Back to top |
|
 |
welgro
Brown Belt

Joined: 24 Sep 2012
Posts: 1784
|
Post: #267  Posted: Fri Dec 05, 2014 5:29 pm Post subject: Posted: Fri Dec 05, 2014 5:29 pm Post subject: |
 |
|

|
|
| Back to top |
|
 |
welgro
Brown Belt

Joined: 24 Sep 2012
Posts: 1784
|
Post: #268  Posted: Fri Dec 05, 2014 5:45 pm Post subject: Posted: Fri Dec 05, 2014 5:45 pm Post subject: |
 |
|
15 Trading Paradoxes
by Stephen Burns,
In over a dozen years of learning what works and what doesn’t in profitable trading I believe there are many paradoxes. Most of trading is counter intuitive and new traders usually enter the market looking for predictions, sure things, hot tips, and to know what to buy. In reality it is following price action as it unfolds, managing risk, trading a plan, and knowing when to sell a wining trade is what really makes the money. Most new traders never become profitable traders because they can never make that leap. Trading is a business and when the new trader becomes a business person and quits wanting to win the trading lottery, that is when the real progress begins.
par·a·dox-
A seemingly contradictory statement that may nonetheless be true.
One exhibiting inexplicable or contradictory aspects.
A statement contrary to received opinion.
Here are 15 paradoxes that I have learned on my own path to consistent profitable trading.
♥ The less I trade the more money I make.
♥ All my biggest profits were made on option contracts I bought not ones I sold.
♥ My number one job as a trader is to manage risks not make money.
♥ The best traders in history were the best risk managers not the best at entries and exits.
♥ The ability to admit you are wrong about a trade and get out is more important than being confident in a wining trade and staying in no matter what.
♥ Winning traders think like a casino losing traders think like gamblers.
♥ Opinions, projections, and predictions are worthless, trade the price action.
♥ At times fundamentals are good helpers to a trader but they are always terrible masters.
♥ Only date trading vehicles but marry your risk management and positive mind set.
♥ The smaller and more focused my watch list the better I trade what is on my watch list.
♥ You can go broke taking profits if your profits are small and your losses are big.
♥ Be very cautious of a small loss becoming a big loss but be open-minded to a nice profit becoming a huge profit.
♥ Being flexible about your market outlook is more important to profitability than committed to your directional view.
♥ I made my trading profits by reacting to price action and following along with the trend not predicting price action and wanting to prove I was right.
♥ Your risk management and mindset will determine your trading success more than your entries and exits will.
|
|
| Back to top |
|
 |
welgro
Brown Belt

Joined: 24 Sep 2012
Posts: 1784
|
Post: #269  Posted: Fri Dec 05, 2014 6:22 pm Post subject: Posted: Fri Dec 05, 2014 6:22 pm Post subject: |
 |
|
Crudeoil 15 min chart "PIPE Bottom Reversal"


|
|
| Back to top |
|
 |
welgro
Brown Belt

Joined: 24 Sep 2012
Posts: 1784
|
|
| Back to top |
|
 |
|

