| View previous topic :: View next topic |
| Author |
Crudeoil Positional Analysis ~ Welgro Corner |
welgro
Brown Belt

Joined: 24 Sep 2012
Posts: 1784
|
Post: #271  Posted: Mon Dec 08, 2014 6:13 am Post subject: Posted: Mon Dec 08, 2014 6:13 am Post subject: |
 |
|
| welgro wrote: |

|

MADE LOW : $64.63
|
|
| Back to top |
|
 |
|
|
 |
AMBY
Yellow Belt

Joined: 05 Sep 2014
Posts: 503
|
Post: #272  Posted: Mon Dec 08, 2014 8:51 am Post subject: CONGRATS. Posted: Mon Dec 08, 2014 8:51 am Post subject: CONGRATS. |
 |
|
GOOD ONE, CLEAN BOWLED. 
|
|
| Back to top |
|
 |
welgro
Brown Belt

Joined: 24 Sep 2012
Posts: 1784
|
Post: #273  Posted: Mon Dec 08, 2014 11:18 am Post subject: Posted: Mon Dec 08, 2014 11:18 am Post subject: |
 |
|
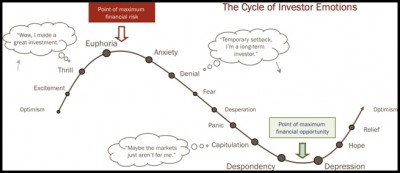
Top 10 Rules for Beginner Traders
1. Have an entry and exit plan
Knowing when to get in, when to get out, and what to do if the trade fails is extremely important. In other words, have an entry strategy, profit target and stop loss.
2. Avoid the first 15 minutes when a market opens
This period of time is usually highly volatile – automated systems, premarket trades and unfounded trades produce choppy price action. You are better off waiting until it levels out and using the ATO (At the Open) Strategy taught in the Mentorship Program.
3. Understand market orders vs. limit orders
Market orders tell your broker to buy or sell at the best available price. Limit orders let you control the maximum and minimum prices at which you will buy and sell. Limit orders are better because you have more control and can be used more easily with strategies.
4. Avoid margin risk
The whole point of trading using a margin is to increase the amount of potential returns on each trade. Leveraging more money puts you at risk so keep your margins in check. Trade with a 4:1 intraday margin, if possible.
5. Don’t guess or follow instincts
Always have a strategy. You need to know objectively what conditions will trigger your entry. And these conditions have to be consistently successful.
6. Keep a log of your trading activity
Your trading software can keep track of your profit and loss performance. You should keep track of your personal development as a trader – improve upon your mistakes. The paper remembers better than the mind.
7. Paper / sim trade first
Practice makes perfect. Paper trading with a live data feed will simulate the experience of live trading as closely as possible without spending real money. Paper trade for as long as you need to before going live.
8. Be wary of where your trading advice comes from
The markets are inherently unpredictable for the most part. In the business of trading, there are many who are a little too confident. Do your research before putting anyone’s advice to the test.
9. Control your losses
When trading with real funds, only trade with money you can afford to lose. If trading ever gets you into financial trouble, take a break and refine your strategy by paper trading with live data.
10. Allow yourself enough time to learn
A baby needs to crawl before being able to walk. Don’t panic at the first hint of loss and throw your strategies out the window. Trading is emotional. Know that you will have losing trades. Being consistent requires discipline with the right, objective trading methods.
| Description: |
|
| Filesize: |
78.79 KB |
| Viewed: |
344 Time(s) |

|
|
|
| Back to top |
|
 |
welgro
Brown Belt

Joined: 24 Sep 2012
Posts: 1784
|
Post: #274  Posted: Mon Dec 08, 2014 1:11 pm Post subject: Posted: Mon Dec 08, 2014 1:11 pm Post subject: |
 |
|


|
|
| Back to top |
|
 |
welgro
Brown Belt

Joined: 24 Sep 2012
Posts: 1784
|
|
| Back to top |
|
 |
welgro
Brown Belt

Joined: 24 Sep 2012
Posts: 1784
|
Post: #276  Posted: Mon Dec 08, 2014 3:22 pm Post subject: Posted: Mon Dec 08, 2014 3:22 pm Post subject: |
 |
|
| welgro wrote: |

|

Made low : 4020
|
|
| Back to top |
|
 |
AMBY
Yellow Belt

Joined: 05 Sep 2014
Posts: 503
|
Post: #277  Posted: Mon Dec 08, 2014 5:08 pm Post subject: Posted: Mon Dec 08, 2014 5:08 pm Post subject: |
 |
|
THANKS FOR POSTING A GRAPH ,
UNABLE TO READ LEVELS ON GRAPH.
|
|
| Back to top |
|
 |
welgro
Brown Belt

Joined: 24 Sep 2012
Posts: 1784
|
|
| Back to top |
|
 |
AMBY
Yellow Belt

Joined: 05 Sep 2014
Posts: 503
|
Post: #279  Posted: Mon Dec 08, 2014 5:37 pm Post subject: Posted: Mon Dec 08, 2014 5:37 pm Post subject: |
 |
|
THANKS FOR QUICK RESPONSE.
TU SI GREAT HO .
|
|
| Back to top |
|
 |
welgro
Brown Belt

Joined: 24 Sep 2012
Posts: 1784
|
Post: #280  Posted: Mon Dec 08, 2014 9:22 pm Post subject: Posted: Mon Dec 08, 2014 9:22 pm Post subject: |
 |
|
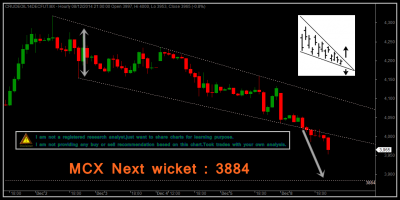
DPR -Daily Price Range in MCX Trading
Every commodity is giving different kind of movement in an every trading day.Every day MCX market is giving Normal range of trading levels in their trading.MCX Exchange fixed Trading Range for every commodity in an every trading day.That Range is Daily Price Range shortly called as DPR.This DPR varies by commodity to commodity due to their volatility of that commodity s nature.
If an abnormal circumstances/unforeseen fundamentals hit the MCX trading,MCX commodities turn upper//bullish/Buying side or down/Bearish/Selling side.When MCX Market in an abnormal fluctuation this Price Range may possible to ride off.When any MCX Commodity reaches the upper limit of daily range is called Upper circuit/upper freeze.If a commodity in an Upper freeze mean there is no seller available in the MCX market to sell that Particular commodity.If a commodity reaches the lower limit of daily range is called Lower Circuit/Lower Freeze.In Lower Freeze mean there will be no buyer in MCX market to buy that commodity that time.
In any commodity in MCX trading breaching Upper/lower circuit/freeze ,there will be cooling Period for 15 minutes.In that cooling period there will be no trading except if buyer /seller willing to buy/sell that particular freezing Commodity.Oncce Cooling Period over,the Daliy Trading Range will be extended little more.
Is it advisable to trade in Upper/lower freeze/Spike Timings in MCX
During these kind of abnormal trading movement timings,avoiding the trade is the best solution for all except well expertised person.
| Description: |
|
| Filesize: |
54.89 KB |
| Viewed: |
351 Time(s) |

|
|
|
| Back to top |
|
 |
welgro
Brown Belt

Joined: 24 Sep 2012
Posts: 1784
|
Post: #281  Posted: Mon Dec 08, 2014 9:44 pm Post subject: Posted: Mon Dec 08, 2014 9:44 pm Post subject: |
 |
|
Reoccuring Price Patterns
Technical Analysis makes the assumption that history repeats itself. Any trading method or system that works well on a broad sample of historical data, may have validity when applied to future trading environments. One should keep in mind that the markets are dynamic. The forces that motivate price movement are dynamic, and the participants are dynamic. Therefore any system which has performed well on past historic data may decline in value as the evolving dynamics of the markets change over time.
The assumption is made that trading results can be improved when trading skills are improved. This requires practice! Surely any time spent learning to trade on past historical data, will not be wasted when it comes to preparing to trade for the future.
http://video.geckosoftware.com/act/reoccuringpricepatterns.htm
| Description: |
|
| Filesize: |
67.05 KB |
| Viewed: |
352 Time(s) |

|
|
|
| Back to top |
|
 |
welgro
Brown Belt

Joined: 24 Sep 2012
Posts: 1784
|
Post: #282  Posted: Mon Dec 08, 2014 10:37 pm Post subject: Posted: Mon Dec 08, 2014 10:37 pm Post subject: |
 |
|
| welgro wrote: | 
|

Made low : $ 63.05.. (Sleeper catch...Missed 0.05 cents)
|
|
| Back to top |
|
 |
welgro
Brown Belt

Joined: 24 Sep 2012
Posts: 1784
|
Post: #283  Posted: Mon Dec 08, 2014 11:12 pm Post subject: Posted: Mon Dec 08, 2014 11:12 pm Post subject: |
 |
|
Plan To carry my short position...
| Description: |
|
| Filesize: |
51.96 KB |
| Viewed: |
351 Time(s) |

|
|
|
| Back to top |
|
 |
AMBY
Yellow Belt

Joined: 05 Sep 2014
Posts: 503
|
Post: #284  Posted: Tue Dec 09, 2014 10:15 am Post subject: $ 62.26 Posted: Tue Dec 09, 2014 10:15 am Post subject: $ 62.26 |
 |
|
EXCELLENT ANALYSIS,
WHAT IS NEXT IN CRUDE.
THANKS A LOT FOR YOUR CHARTS AND GUIDANCE. 
|
|
| Back to top |
|
 |
welgro
Brown Belt

Joined: 24 Sep 2012
Posts: 1784
|
Post: #285  Posted: Tue Dec 09, 2014 12:04 pm Post subject: Posted: Tue Dec 09, 2014 12:04 pm Post subject: |
 |
|
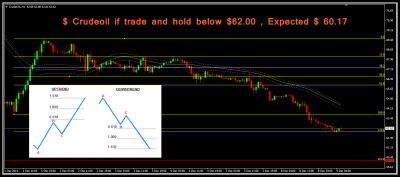
Most trading platform will be able to help you to draw the levels easily.
There are a lot of traders who are having problems with trading the Fibonacci as they do not always find the price respecting the levels. This is because those are not the Fibonacci setup and therefore do not display the patterns as discussed above.
Trading setup:
Time frame: all (preferably 5min or 15min to doing day-trading).
Currency pairs: any.
Rules:
Step 1: Draw a Fibonacci retracement level
Step 2: Check if there is any support on the 0.328, 0.5 or 0.618 levels
Step 3: If there is no support formed on any of these levels, it is not a fibonacci pattern. Repeat step 1 until you can find one. If there is support formed on any of the levels in step 2, you can then look for opportunity to get into a trade
Step 4: then pick the extension level as your exit position, usually use 1.618 levels
https://www.dukascopy.com/fxcomm/fx-article-contest/?Fibonacci-Trading-Strategy-Part&action=read&id=629
| Description: |
|
| Filesize: |
32.39 KB |
| Viewed: |
325 Time(s) |

|
| Description: |
|
| Filesize: |
62.9 KB |
| Viewed: |
333 Time(s) |

|
|
|
| Back to top |
|
 |
|

