|
|
| View previous topic :: View next topic |
| Author |
Crudeoil Positional Analysis ~ Welgro Corner |
welgro
Brown Belt

Joined: 24 Sep 2012
Posts: 1784
|
Post: #286  Posted: Tue Dec 09, 2014 4:14 pm Post subject: Posted: Tue Dec 09, 2014 4:14 pm Post subject: |
 |
|
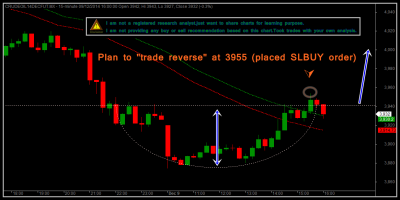
Plan to trade reverse at 3955 (placed SLBUY order)
| Description: |
|
| Filesize: |
60.28 KB |
| Viewed: |
329 Time(s) |
|
|
|
| Back to top |
|
 |
|
|  |
welgro
Brown Belt

Joined: 24 Sep 2012
Posts: 1784
|
Post: #287  Posted: Tue Dec 09, 2014 5:03 pm Post subject: Posted: Tue Dec 09, 2014 5:03 pm Post subject: |
 |
|
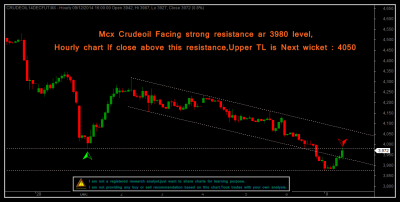
Support & Resistance Lines
Fundamentally to be able to trade you need to be capable of describing what the price activity is doing on a chart. When you look at the chart, you are in the process of identifying and describing where the price is and what it is doing. A common and basic tool is resistance and support lines. The resistance and support lines prove where the emotions of the market are clustered.
Support
Support is where the price stops falling and comes to a temporary rest. We call this area support. The price has for the time being stopped falling and is now resting on the floor so to speak.
Resistance
Resistance is where the price stops rising and takes a break. The movement has at least temporarily hit a ceiling you can say.
http://www.fairbinaryoptions.com/strategies/support-resistance-lines/
| Description: |
|
| Filesize: |
65.1 KB |
| Viewed: |
339 Time(s) |
|
|
|
| Back to top |
|
 |
ragavan
White Belt

Joined: 24 Sep 2014
Posts: 12
|
Post: #288  Posted: Tue Dec 09, 2014 5:58 pm Post subject: Posted: Tue Dec 09, 2014 5:58 pm Post subject: |
 |
|
Dear Welgro
Please update nifty support chart
|
|
| Back to top |
|
 |
kifs
White Belt

Joined: 22 Jul 2009
Posts: 26
|
Post: #289  Posted: Tue Dec 09, 2014 7:14 pm Post subject: Posted: Tue Dec 09, 2014 7:14 pm Post subject: |
 |
|
Hold the buy position or exit and make a short position with sl 3980
| welgro wrote: | Support & Resistance Lines
Fundamentally to be able to trade you need to be capable of describing what the price activity is doing on a chart. When you look at the chart, you are in the process of identifying and describing where the price is and what it is doing. A common and basic tool is resistance and support lines. The resistance and support lines prove where the emotions of the market are clustered.
Support
Support is where the price stops falling and comes to a temporary rest. We call this area support. The price has for the time being stopped falling and is now resting on the floor so to speak.
Resistance
Resistance is where the price stops rising and takes a break. The movement has at least temporarily hit a ceiling you can say.
http://www.fairbinaryoptions.com/strategies/support-resistance-lines/ |
|
|
| Back to top |
|
 |
welgro
Brown Belt

Joined: 24 Sep 2012
Posts: 1784
|
|
| Back to top |
|
 |
welgro
Brown Belt

Joined: 24 Sep 2012
Posts: 1784
|
Post: #291  Posted: Wed Dec 10, 2014 9:39 am Post subject: Posted: Wed Dec 10, 2014 9:39 am Post subject: |
 |
|
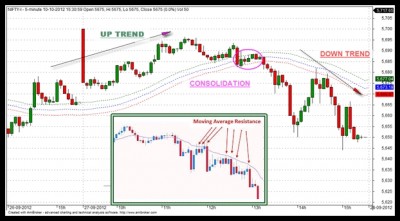
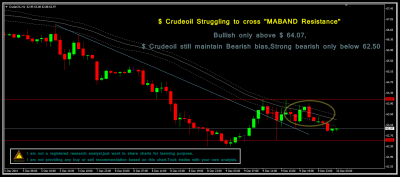
Moving average line trading
This is a line that connects average prices over a long period of time. This line helps you gain an insight into the market’s price fluctuation trends. You can then compare real price movements with the moving average, and speculate fluctuations in foreign currency exchange rates accordingly. When the price moves up and crosses the moving average line, it simply means that the market is gaining momentum, and this might be a good time for you to trade.
Here are two very good examples that will help you understand what trendline trading is all about. The first example illustrates trendline resistance and the second chart shows trendline support.
http://www.ea-coder.com/4-simple-forex-trading-strategies/
| Description: |
| i am using Maband [high low open] 40 SMA |
|
| Filesize: |
152.9 KB |
| Viewed: |
351 Time(s) |
|
| Description: |
|
| Filesize: |
65.71 KB |
| Viewed: |
350 Time(s) |
|
|
|
| Back to top |
|
 |
welgro
Brown Belt

Joined: 24 Sep 2012
Posts: 1784
|
|
| Back to top |
|
 |
AMBY
Yellow Belt

Joined: 05 Sep 2014
Posts: 503
|
Post: #293  Posted: Wed Dec 10, 2014 12:02 pm Post subject: THANKS FOR 3932 LEVEL Posted: Wed Dec 10, 2014 12:02 pm Post subject: THANKS FOR 3932 LEVEL |
 |
|
FOR FRESH UPDATES, AS I HAD TAKEN SHORT POSITION,
NOW I HAD COVERED IT. 
|
|
| Back to top |
|
 |
welgro
Brown Belt

Joined: 24 Sep 2012
Posts: 1784
|
Post: #294  Posted: Wed Dec 10, 2014 1:11 pm Post subject: Posted: Wed Dec 10, 2014 1:11 pm Post subject: |
 |
|
What Indicators Work for Real World Swing Trading Tactics?
I always look at technical indicators as serving two different roles. One role is to identify specific market conditions or to further my analysis. I call these general indicators, because they are not used to time my entries or my exits, but are used more often than not for general analysis.
One perfect example is the moving average indicator. I find the simple moving average and the exponential moving average to be very valuable indicators, not for telling me when to enter my favorite Stock or Futures Market but instead to guide me in the right market direction or trend.
I agree with the fact that moving average indicators are not the best indicators because they are lagging, and do not make real time trading very efficient or precise. But for determining the direction of the trend I find them to be extremely useful and beneficial the great majority of the time.
The other type of indicator I call specific indicators or set up indicators. These are the indicators that tell me specifically where to enter the market and where to exit the market and where to place my profit target and stop loss orders.
If you ever read Market Wizard books there is an article by a very famous trader. He discusses indicators and compares indicators to lenses. He goes on to discuss how every lens will color the view, but the clearest view comes from not having a lens. Well those few words are very important to understand, because the clearest indication of price action is price action itself.
Think about it for a minute, you use indicators that are based on price action to determine what price action is going to do next, instead of looking at the actual price without any filter in between.
If you notice most of my entries and exits are based on price levels or actual price bars. I use actual price data to determine most of my entries and exits. Remember, there is no better technical indicator than price itself and the next time you are looking for the major indicator that has no lag or delay and gives you the best indication of the market just look at the actual price itself.
I will do expand on this article in the future; I believe there is great difference between swing trading tactics that work in the real world and swing trading tactics that work only on paper.
http://www.marketgeeks.com/swing-trading-tactics/
~~~~~~~~~~~~~~~~~~~~~~~~~~~~~~~~~~~~~~~~
Seven Tools to Boost Trading Skills and Profitability
Nearly every successful trader keeps a trading journal. They know it is one of the most powerful things they can do to influence their trading skills and, ultimately, their profitability. Most traders, however, don't understand how to keep an effective diary. Here are seven tools you can use to help put you into the realm of the profitable trader.
1. Do the numbers. Keep a notebook of your key markets. It's simply not enough just to look at charts. Write down the high, low, close, & volume of the markets you follow and your most important indicators. Not only will this practice help you keep in tune with your market, you will actually be surprised at how quickly you will hone your tape-reading skills.
2. Record all trades. You must do this. It is fundamental to a trading journal and essential to all the potential transformation that flows from it. Just do it!
3. Record your thoughts and feelings on every trade. If you want to understand your trading psychology, this is the authentic pathway. Thoughts and feelings shape behavior. Just as there are tradable patterns in the markets, there are patterns in your thoughts and feelings that prompt you to trade in a certain way. Learn these.
4. Identify your strengths and limitations. You need to know what you are good at and can rely on, as well as where you reach your current limits. Link your thoughts/feelings/behaviors to each.
5. Develop a plan to overcome your limitations. This is the whole point of your trading journal. Pick one limitation that you want to change and develop a plan to address the thoughts and feelings associated with that limitation. Look to your strengths as guidance in altering what is holding you back. Specify the steps needed to make this a reality tomorrow and into the future.
6. Track your personal performance. Your personal data shows progress and also reveals problematic areas to improve. Track your wins vs. losses and related data (e.g., average win/average loss; wins & losses in an uptrend vs. downtrend vs. trading range, etc.). Do you now see why #2 is so vital to you as a trader?
7. Make journaling a part of your routine. Write your diary at the end of every trading day. Each week, month, quarter and beyond, review your journal to identify areas to work on as well as your progress. Like a runner who can't go a day without a run, you will soon become a trader immersed in the process of self-development and profitability. You are now on the path of the master trader!
Used correctly, the trade journal helps you build not only your technical skills but your mental skills as well. Trading psychology is a key component to trading success.
by Gary Dayton
|
|
| Back to top |
|
 |
welgro
Brown Belt

Joined: 24 Sep 2012
Posts: 1784
|
|
| Back to top |
|
 |
welgro
Brown Belt

Joined: 24 Sep 2012
Posts: 1784
|
Post: #296  Posted: Wed Dec 10, 2014 8:23 pm Post subject: Posted: Wed Dec 10, 2014 8:23 pm Post subject: |
 |
|
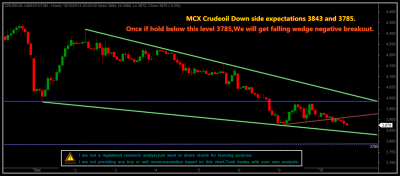
MCX Crudeoil Down side expectations 3843 and 3785.
| Description: |
|
| Filesize: |
92.34 KB |
| Viewed: |
302 Time(s) |
|
|
|
| Back to top |
|
 |
welgro
Brown Belt

Joined: 24 Sep 2012
Posts: 1784
|
Post: #297  Posted: Wed Dec 10, 2014 9:06 pm Post subject: Posted: Wed Dec 10, 2014 9:06 pm Post subject: |
 |
|
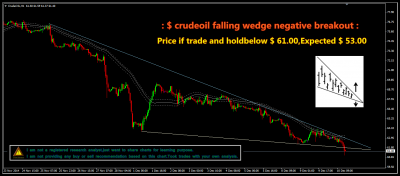
| welgro wrote: | Crudeoil positional analysis 10.12.14 Update III

|

Made low : $ 61.30
|
|
| Back to top |
|
 |
welgro
Brown Belt

Joined: 24 Sep 2012
Posts: 1784
|
Post: #298  Posted: Wed Dec 10, 2014 9:43 pm Post subject: Posted: Wed Dec 10, 2014 9:43 pm Post subject: |
 |
|
Falling or Declining
This formation occurs when the slope of price bar highs and lows join at a point forming an declining wedge. The slope of both lines is down with the upper line being steeper than the lower one. To trade this formation, place an order on a break up and out of the wedge or a sell order on a break down and out the wedge. Falling wedges, with a prior uptrend, are anticipated to break up and out, rather than down and out.
http://video.geckosoftware.com/act/reoccuringpricepatterns.htm
| Description: |
|
| Filesize: |
85.96 KB |
| Viewed: |
303 Time(s) |
|
|
|
| Back to top |
|
 |
welgro
Brown Belt

Joined: 24 Sep 2012
Posts: 1784
|
|
| Back to top |
|
 |
welgro
Brown Belt

Joined: 24 Sep 2012
Posts: 1784
|
Post: #300  Posted: Thu Dec 11, 2014 7:32 am Post subject: Posted: Thu Dec 11, 2014 7:32 am Post subject: |
 |
|
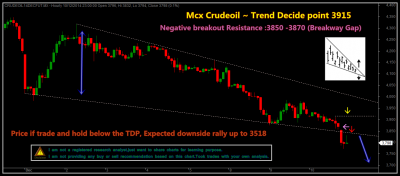
LIQUIDITY GAPS AND SPIKE REMOVALS

Video notes:
Liquidity gaps can be very valuable in both dissecting price and distinguishing major reversal points or price targets.
When using as a meter to take profits, do so when gap risk becomes considerably lower, at the base or origin or the spike.
Trade in line with the prevailing, underlying trend.
Use as a guide of knowing when to stay out, or be patient for better risk / reward.
Know how to identify the four major types of gaps, which ones fill and which ones don’t.
Don’t “fudge” the setup. If things don’t line up or are ambiguous, this is probably the case to everyone else.
Applicable to all time frames; concept is still very much the same.
Learning and successful application are two very different things. Filling the gap between them takes time based on your own effort, diligence, sensibilities, etc.
http://www.youtube.com/watch?v=-8Qf0BwKbUs
http://www.nobrainertrades.com/2011/05/liquidity-gaps-and-spike-removals.html
| Description: |
|
| Filesize: |
101.55 KB |
| Viewed: |
313 Time(s) |
|
|
|
| Back to top |
|
 |
|
|
You cannot post new topics in this forum
You cannot reply to topics in this forum
You cannot edit your posts in this forum
You cannot delete your posts in this forum
You cannot vote in polls in this forum
You can attach files in this forum
You can download files in this forum
|
Powered by phpBB © 2001, 2005 phpBB Group
|
|
|

