| View previous topic :: View next topic |
| Author |
Crudeoil Positional Analysis ~ Welgro Corner |
welgro
Brown Belt

Joined: 24 Sep 2012
Posts: 1784
|
Post: #301  Posted: Thu Dec 11, 2014 4:12 pm Post subject: Posted: Thu Dec 11, 2014 4:12 pm Post subject: |
 |
|

|
|
| Back to top |
|
 |
|
|
 |
welgro
Brown Belt

Joined: 24 Sep 2012
Posts: 1784
|
|
| Back to top |
|
 |
welgro
Brown Belt

Joined: 24 Sep 2012
Posts: 1784
|
Post: #303  Posted: Fri Dec 12, 2014 7:22 am Post subject: Posted: Fri Dec 12, 2014 7:22 am Post subject: |
 |
|
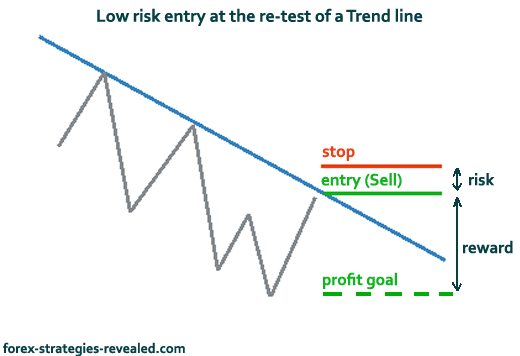
No matter what trading system you use, if you make sure your risk:reward ratio is set properly, you'll be trading on a profitable side, even when the number of your losing trades is greater than the number of winning trades.
What is risk/reward ratio?
Risk - simply referred to the amount of assets being put at risk. In Forex it is the distance of our Stop loss level (in pips) multiplied by the number of lots traded. E.g. a stop loss at 50 pips with 2 lots traded would give us a total risk of 100 pips.
Reward - the amount of pips we look to gain in any particular trade - in other words the distance to a Take Profit level.
Example of risk/reward ratio:
100 pips stop vs 200 pips profit goal gives us 1:2 risk/reward.
25 pips stop vs 75 pips profit gives 1:3 risk/reward ratio.
http://forex-strategies-revealed.com/money-management-systems/risk-reward-ratio

| Description: |
|
| Filesize: |
32.9 KB |
| Viewed: |
353 Time(s) |

|
| Description: |
|
| Filesize: |
62.09 KB |
| Viewed: |
370 Time(s) |
|
|
|
| Back to top |
|
 |
welgro
Brown Belt

Joined: 24 Sep 2012
Posts: 1784
|
Post: #304  Posted: Fri Dec 12, 2014 9:49 am Post subject: Posted: Fri Dec 12, 2014 9:49 am Post subject: |
 |
|
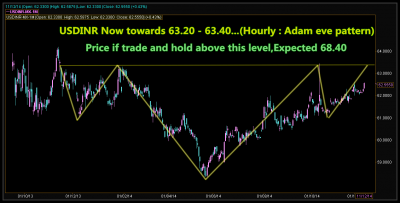
USDINR ~ Positional analysis 12.12.14 update I
Inverse Head and Shoulders
The inverse head and shoulders occurs when a downtrend reverses into an uptrend, and is basically the head and shoulders pattern we have just analyzed turned upside down. As such, it’s really just a gradual change in the direction of the trend, marked by a penetrated trendline and weakening of the current trend.
Inverse Head and Shoulders
Again, there are three points to the pattern, with the middle one, the head, being lower than the shoulders. The neckline is drawn across the two peaks between the low points, and it’s necessary for the price to rise clear of the neckline, otherwise it could just be a consolidation or sideways trend. The neckline is quite likely to slant downward, but does not have to for the pattern to be valid. If it slopes upward, then you will have to wait a little longer for it to be broken and to enter a long position, but it does indicate greater strength in the market.

http://www.financial-spread-betting.com/course/inverse-head-and-shoulders.html
| Description: |
|
| Filesize: |
94.82 KB |
| Viewed: |
343 Time(s) |
|
|
|
| Back to top |
|
 |
welgro
Brown Belt

Joined: 24 Sep 2012
Posts: 1784
|
Post: #305  Posted: Fri Dec 12, 2014 11:04 am Post subject: Crudeoil positional analysis 12.12.14 Update I Posted: Fri Dec 12, 2014 11:04 am Post subject: Crudeoil positional analysis 12.12.14 Update I |
 |
|
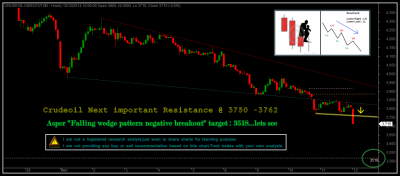
Crudeoil positional analysis 12.12.14 Update I
Trading Methods – What Works and What Doesn’t
The are many successful traders using a variety of trading methods. However, there are a far greater number of traders who fail to produce consistent profits from the markets. I would estimate the percentage of successful traders about the same as in other professions such as acting, music, sports, etc. Many are called, yet few succeed. Over the years I’ve formed a few opinions on why trading is so difficult for so many people. Most traders I meet are intelligent. They have had success in other careers. They are usually hard workers and devote much time and energy to their trading. Yet most of these traders move from one methodology to another, never finding anything that works for them.
In the area where I live I try to attend as many trading groups and meetings that I can find. Trading can be a lonely business when you trade your own account. It is important to maintain human contact. That is face to face contact and not just communicating on Twitter. One trading group that I’ve belonged to for several years seems to be a laboratory for watching traders who go down dead end roads. I’ve tried to draw some conclusions why these traders consistently go in the wrong direction regarding their methodology.
- Doug Tucker
via - Tucker Report
Read more :- http://tuckerreport.com/articles/trading-methods-what-works-and-what-doesnt/
| Description: |
|
| Filesize: |
105.65 KB |
| Viewed: |
368 Time(s) |
|
|
|
| Back to top |
|
 |
welgro
Brown Belt

Joined: 24 Sep 2012
Posts: 1784
|
|
| Back to top |
|
 |
welgro
Brown Belt

Joined: 24 Sep 2012
Posts: 1784
|
Post: #307  Posted: Fri Dec 12, 2014 3:12 pm Post subject: Posted: Fri Dec 12, 2014 3:12 pm Post subject: |
 |
|
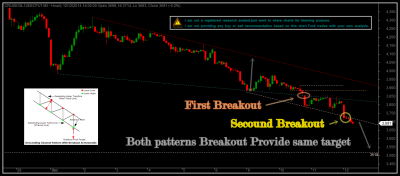
Crudeoil positional analysis 12.12.14 Update III
Tutorial on Descending Channel Chart Pattern
What is Descending Channel Chart Pattern?
It is also known as Bearish Channel. It consist of two trendline parallel to each other having points forming lower highs and lower lows, thus forming a downside or bearish channel. The price is confined between the two trendlines. It consist of the following:
a. Descending Upper Trendline: Also known as the main trendline or primary trendline. It is called so because it is the one which determines the trend. It should have atleast two consecutive points forming lower highs. More point is the indication of more strength in the pattern. The main trendline acts as a resistance in descending Channel pattern
b. Descending Lower Trendline: Also known as the channel line or secondary trendline. This is drawn in parallel to the main trendline. It serves as an support in this pattern. It should also have a minimum of 2 consecutive lower lows point. More points indicates more strength in the pattern.
Breakout: It can occur in any direction upside or downside. If the breakout is in upside direction, it indicates that the downtrend is over and bulls have taken over bears and indicates a buy signal. However if the breakout is in downside direction it indicates further selling pressure and indicates a sell signal.
Volume: Like other chart pattern volume do play a vital role in reaffirming the pattern here. For a descending channel pattern the volume should decrease with the formation of the pattern and there is increase in volume activity after the breakout.
Price Target: One can roughly put a price target after a breakout, and it should be the height of the channel, however other indicators have to considered as well like volume,MACD, RSI, etc.
Duration: Channel pattern Formation takes from a few weeks to many months. Longer the duration is considered to be more reliable than the short duration one. If it is shorter than 3 weeks then it is considered to be flag rather than channel.
Thanks to : .topstockresearch.
| Description: |
|
| Filesize: |
118.02 KB |
| Viewed: |
516 Time(s) |
|
|
|
| Back to top |
|
 |
welgro
Brown Belt

Joined: 24 Sep 2012
Posts: 1784
|
Post: #308  Posted: Fri Dec 12, 2014 4:24 pm Post subject: Posted: Fri Dec 12, 2014 4:24 pm Post subject: |
 |
|
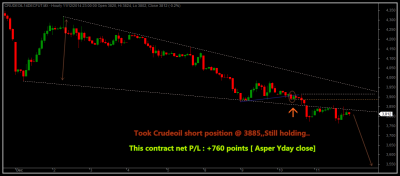
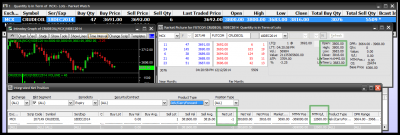
Open position update :-
Still holding short position....Short position took at 3885
| Description: |
|
| Filesize: |
63.22 KB |
| Viewed: |
444 Time(s) |
|
|
|
| Back to top |
|
 |
welgro
Brown Belt

Joined: 24 Sep 2012
Posts: 1784
|
Post: #309  Posted: Fri Dec 12, 2014 7:52 pm Post subject: Posted: Fri Dec 12, 2014 7:52 pm Post subject: |
 |
|
Lower freeze point
| Description: |
|
| Filesize: |
50.98 KB |
| Viewed: |
394 Time(s) |

|
|
|
| Back to top |
|
 |
welgro
Brown Belt

Joined: 24 Sep 2012
Posts: 1784
|
Post: #310  Posted: Sat Dec 13, 2014 12:39 pm Post subject: Posted: Sat Dec 13, 2014 12:39 pm Post subject: |
 |
|
 [img][/img] [img][/img]
|
|
| Back to top |
|
 |
welgro
Brown Belt

Joined: 24 Sep 2012
Posts: 1784
|
Post: #311  Posted: Sun Dec 14, 2014 7:35 am Post subject: Posted: Sun Dec 14, 2014 7:35 am Post subject: |
 |
|
Previously we mentioned,Crudeoil breakout target $44.00 ( 11th November 2014, 11:07 PM )
| welgro wrote: | crudeoil ~ Long term view

|
Made Low : $57.50

|
|
| Back to top |
|
 |
voyager
White Belt

Joined: 05 Sep 2011
Posts: 63
|
Post: #312  Posted: Sun Dec 14, 2014 8:27 am Post subject: Re: Crudeoil positional analysis 12.12.14 Update II Posted: Sun Dec 14, 2014 8:27 am Post subject: Re: Crudeoil positional analysis 12.12.14 Update II |
 |
|
| welgro wrote: | 

Strategies of Using Support, Resistance and Trend Line
Basically, there are two strategies which can be applied based on support and resistance. The first is called “bounce trading”, the second is “breakout trading”.
Bounce trading
Some traders call is as “swing trading”. This method uses the bounce that occurs from the support or resistance. The illustration below will visually explain bounce trading strategy.
The point is to wait for a bounce from the support or resistance area to execute a trade. Why don’t just put the trade right at the support or resistance level? Because you will need some kind of confirmation that the support or resistance has not broken yet. The fall or the rise of the price could be very sharp and rapid so that the support or resistance breaks immediately. This bounce is expected to be some kind of sign that the support or resistance level remains strong.
http://www.mysmartfx.com/en/elementary-2/strategies-of-using-support-resistance-and-trend-line/ |
very useful. thanx for providing such an elaborative material under the single head.
|
|
| Back to top |
|
 |
welgro
Brown Belt

Joined: 24 Sep 2012
Posts: 1784
|
Post: #313  Posted: Sun Dec 14, 2014 8:55 am Post subject: Posted: Sun Dec 14, 2014 8:55 am Post subject: |
 |
|
Trendlines and Channels- Draw a manual Trend line


Trendlines & Channels
As mentioned earlier, a trendline is a straight line drawn over the price to connect the swing highs in a downtrend, or under the price to connect the swing lows in an uptrend, to represent the main direction of price and to identify areas of support and resistance.
Pivot points are essential in drawing trendlines. Pivot points are basically turning points referred to as reaction highs/lows, or more commonly as swing highs/lows. In a downtrend, a trendline is applied by connecting two pivot highs or swing high points (point A to point B). But in an uptrend, a trendline is applied by connecting two pivot lows or swing lows (point C to point D).
http://forexwinners.ru/forex/trendlines-and-channels-draw-a-manual-trend-line/
|
|
| Back to top |
|
 |
acharyams
Yellow Belt

Joined: 04 Jul 2010
Posts: 552
|
Post: #314  Posted: Sun Dec 14, 2014 9:02 am Post subject: Posted: Sun Dec 14, 2014 9:02 am Post subject: |
 |
|
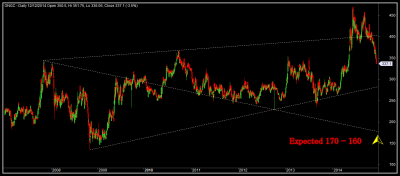
| welgro, I request your current view on ONGC. Can we buy here for long term?
|
|
| Back to top |
|
 |
welgro
Brown Belt

Joined: 24 Sep 2012
Posts: 1784
|
Post: #315  Posted: Sun Dec 14, 2014 11:25 am Post subject: Posted: Sun Dec 14, 2014 11:25 am Post subject: |
 |
|
| acharyams wrote: | | welgro, I request your current view on ONGC. Can we buy here for long term? |
| Description: |
|
| Filesize: |
52.07 KB |
| Viewed: |
363 Time(s) |
|
|
|
| Back to top |
|
 |
|

