| View previous topic :: View next topic |
| Author |
Crudeoil Positional Analysis ~ Welgro Corner |
welgro
Brown Belt

Joined: 24 Sep 2012
Posts: 1784
|
Post: #361  Posted: Mon Dec 22, 2014 8:53 pm Post subject: Posted: Mon Dec 22, 2014 8:53 pm Post subject: |
 |
|
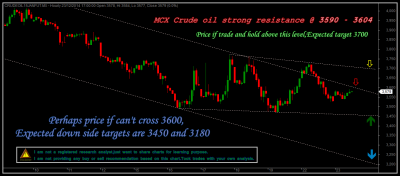
Crudeoil positional analysis 22.12.14 Update VI
| Description: |
|
| Filesize: |
72.84 KB |
| Viewed: |
425 Time(s) |
|
|
|
| Back to top |
|
 |
|
|
|
welgro
Brown Belt
Joined: 24 Sep 2012
Posts: 1784
|
| Post: #362 Posted: Tue Dec 23, 2014 9:22 am Post subject: |
|
|
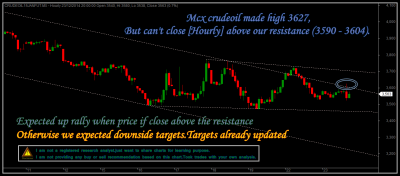
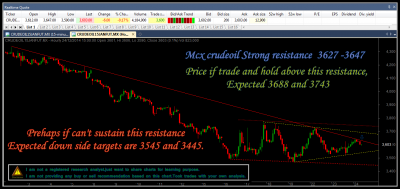
Crudeoil positional analysis 23.12.14 Update I
| Description: |
|
| Filesize: |
185.38 KB |
| Viewed: |
432 Time(s) |
|
|
|
| Back to top |
|
|
welgro
Brown Belt
Joined: 24 Sep 2012
Posts: 1784
|
| Post: #363 Posted: Tue Dec 23, 2014 5:28 pm Post subject: |
|
|
Crudeoil positional analysis 23.12.14 Update II
| Description: |
|
| Filesize: |
101.05 KB |
| Viewed: |
420 Time(s) |
|
|
|
| Back to top |
|
|
AMBY
Yellow Belt

Joined: 05 Sep 2014
Posts: 503
|
| Post: #364 Posted: Tue Dec 23, 2014 7:14 pm Post subject: GOOD EVENING, |
|
|
SIR,
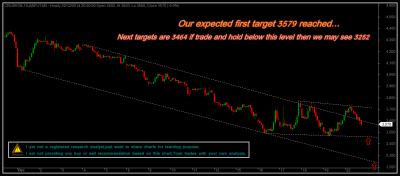
AS PER YOUR CHART CRUDE HAS CROSSED THE 3590 AND 3604,
SO IT CONFIRMS BUY?
AM I CORRECT ? WHAT WILL BE SUPPORT FOR BUY?
THANKS ,
|
|
| Back to top |
|
|
welgro
Brown Belt
Joined: 24 Sep 2012
Posts: 1784
|
| Post: #365 Posted: Tue Dec 23, 2014 8:40 pm Post subject: |
|
|
Crudeoil positional analysis 23.12.14 Update III
| Description: |
|
| Filesize: |
112.38 KB |
| Viewed: |
419 Time(s) |
|
|
|
| Back to top |
|
|
welgro
Brown Belt
Joined: 24 Sep 2012
Posts: 1784
|
|
| Back to top |
|
|
manojkr78
Green Belt

Joined: 07 Mar 2011
Posts: 1014
|
| Post: #367 Posted: Tue Dec 23, 2014 10:01 pm Post subject: |
|
|
| thanks for the information.....
|
|
| Back to top |
|
|
welgro
Brown Belt
Joined: 24 Sep 2012
Posts: 1784
|
|
| Back to top |
|
|
mk27
White Belt

Joined: 05 Aug 2014
Posts: 3
|
| Post: #369 Posted: Wed Dec 24, 2014 9:41 am Post subject: |
|
|
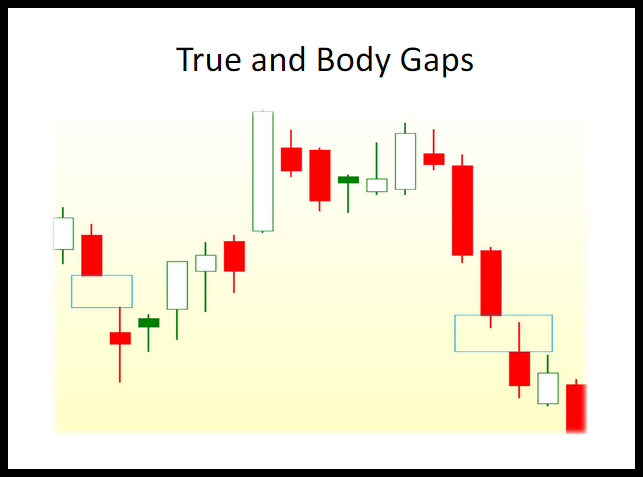
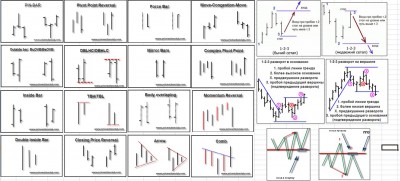
True gaps and body gaps...nice information..Welgro !! 
|
|
| Back to top |
|
|
welgro
Brown Belt
Joined: 24 Sep 2012
Posts: 1784
|
| Post: #370 Posted: Wed Dec 24, 2014 4:14 pm Post subject: |
|
|
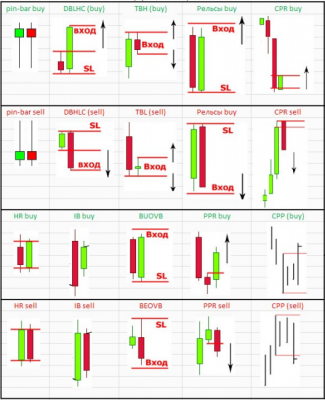
Crudeoil positional analysis 24.12.14 Update I
and
Some important price action patterns (Group bars)
| Description: |
|
| Filesize: |
188.09 KB |
| Viewed: |
484 Time(s) |
|
| Description: |
|
| Filesize: |
241.74 KB |
| Viewed: |
480 Time(s) |
|
| Description: |
|
| Filesize: |
128.8 KB |
| Viewed: |
441 Time(s) |
|
|
|
| Back to top |
|
|
welgro
Brown Belt
Joined: 24 Sep 2012
Posts: 1784
|
| Post: #371 Posted: Wed Dec 24, 2014 9:05 pm Post subject: |
|
|
| welgro wrote: |

|
Made low 3527..
|
|
| Back to top |
|
|
kifs
White Belt
Joined: 22 Jul 2009
Posts: 26
|
| Post: #372 Posted: Mon Dec 29, 2014 6:36 pm Post subject: |
|
|
| Any view on Crude oil
|
|
| Back to top |
|
|
welgro
Brown Belt
Joined: 24 Sep 2012
Posts: 1784
|
|
| Back to top |
|
|
AMBY
Yellow Belt
Joined: 05 Sep 2014
Posts: 503
|
| Post: #374 Posted: Fri Jan 09, 2015 10:34 am Post subject: HAPPY NEW YEAR |
|
|
IT IS NICE OF YOU FOR POSING FRESH UPDATE ON CRUDE OIL,
PLEASE POST YOUR VIEWS FOR N. G.

|
|
| Back to top |
|
|
welgro
Brown Belt
Joined: 24 Sep 2012
Posts: 1784
|
| Post: #375 Posted: Fri Jan 09, 2015 5:41 pm Post subject: |
|
|
Crudeoil positional analysis 09.01.15 Update II

Chart Patterns. Trends
The price action of stocks can generally move in one of three ways , Up , Down and sideways. I use chart pattern setups to identify changes in trend direction or continuation patterns that increase the risk reward in my favor when trading.
A stock is said to be in an up trend when it makes a series of higher highs and higher lows. This can easily be identified on a chart as a series of steps like those on a staircase which cause the share price to rise. Below is an example of such a pattern
Uptrend
Therefore one of my first trading rules is to buy a share that has a chart that looks like the one above.
A downtrend is the direct opposite of an up trend in that it has a series of pivot point highs that are formed lower than the preceding high and each pivot low is also lower. An example of a down trend is shown below. Study this chart carefully as every trader needs to avoid buying any share that displays the following chart in order to survive as a trader.

Read More :- http://stockpickr.wordpress.com/2013/06/11/chart-patterns-trends/
|
|
| Back to top |
|
|
|