|
|
| View previous topic :: View next topic |
| Author |
Dealing with Reversal |
skd2012
Yellow Belt

Joined: 03 Oct 2012
Posts: 948
|
Post: #1  Posted: Sat Apr 27, 2013 8:29 am Post subject: Dealing with Reversal Posted: Sat Apr 27, 2013 8:29 am Post subject: Dealing with Reversal |
 |
|
Hi Guys, hope you all are doing well! I am doing good, specially a lot better in last 15 days.
All we know that we can make money by being in the trend. It is a lot more easier to trade short or long in intraday when we know over all swing trend. However one needs to know when the trend would change a bit in advance for not getting caught in the reversal and also it helps in not fighting the trend specially in the last part of the trending move.
Different signs can tell that the trend may change in near future. We retail traders lose money in this period (5-6 days before swing trend change) by fighting the trend and when actual trend reversal happens we make lot of damage to the account. Also some get caught in the reversal sometime. Analysis on following points would help to understand things more relaxly.
Helps when NIFTY trend is maturing and reversal can happen -
1. Most inportant indicator is our self. When we think NIFTY swing trend will change based on some technical analysis like trend line, wedges, Fibo etc., it happens 5-6 days later. Monthly trend or bigger trend change happens 2-3 months later than when we think. So important is that we wait patiently in this period and trade nimble footed! Market attracts us to fight the trend in this period.
2. Some time trend reversal can be caught based on option data -
A. Sometime PCR helps along with other studies (please note we are not trying to find out exact date or level for reversal) For example 0.9-0.8 for down swing reversal and 1.2 or more for up swing reversal.
B. Many time NIFTY future would show breakout, but option value will make double top or even lower top. This is very important sign as we are option heavy market now.
C. NIFTY option OI, NF price action at highest OI strike etc.
D. In some situation NIFTY options will have premium bias to show early indication. For example on 26th April when NF was at 5910 5800 PUT traded at 57 around and 6000 CALL traded at around 52.
3. Important index stocks coming to support/resistance range specially weekly chart support/resistance, which reflects where investor has buying or selling interest. We have seen this recently when INFY tested 2200 and SBI tested sub 2000 level. This gives clear sign that market will change trend anytime soon.
4. One of the signs, when final stage of the bigger trend change happens when Dogs start running. For example when market made top at 6110, we saw Relcap, reliance, TISCO, RCOM, relinfra, bhel ran high (in reversal they fell hard).
5. Sometime global market helps to know that our market can change trend. This is specially helpful in up trending market.
6. Diverging move between BankNifty and NIFTY. Sometime Banknifty works as a leading indicator. It corrects first and then NIFTY vice versa. We get early indication from this. It does not mean that reversal from next day, just an early indication.
7. Divergence in technical indicators. This gives indication, but one needs patience here!!
8. Midcaps and small caps work as leading indicator many times. They crashes first and then NIFTY follows them. It happens in case of up move as well. I think we have 10-15 days time lag is there!
I have not stated anything new. Perhaps everybody knows about them. Perhaps I missed some points! Feel free to add them. Hope you find it interesting!
Based on above points, try to judge at what stage NIFTY up move is in now!! Excuse my English. 
All the best and happy trading.
|
|
| Back to top |
|
 |
|
| |
bharatpatel
White Belt

Joined: 26 Oct 2011
Posts: 401
|
| Post: #2 Posted: Sat Apr 27, 2013 11:21 am Post subject: hi |
|
|
Dear Friend,
If we will busy checking all that things then when will we trade?
Important is that we make proper entry with reasonable sl.
If we gather all the information and sort it out,chances are we may got confuse.
So as Mr.Veerappan says : follow your set up of chart with yr choice of tf...
with yr choice of indicator..... with yr choice of ema/sma/bb
and wait for signal (buy / sell) and trade accordingly.
why we waste our time to decide is it main trend or sub trend or reversal or anything else? whatever it is, let it be.
Stoploss is part of our game so if it is weak signal stop may taken but when you get next signal it may be in tune with trend.
We are here to find entries with proper stop loss and if it is in our favor then try to manage the trade and protect the profit. That's it.
Why try to become a Historian ?
Hope i am not hurting you.
Namaste...
|
|
| Back to top |
|
|
vinay28
Black Belt

Joined: 24 Dec 2010
Posts: 11748
|
| Post: #3 Posted: Sat Apr 27, 2013 11:58 am Post subject: |
|
|
bharat, I feel you have hurt skd whose post seems to be an innocent one, not just warning traders but also seeking comments/contributions. Your post only succeds in pouring water on it.
Incidentally, what skd has posted is a very important aspect, right or wrong.
Last edited by vinay28 on Sat Apr 27, 2013 7:20 pm; edited 1 time in total |
|
| Back to top |
|
|
Just Trade
Brown Belt


Joined: 15 Nov 2007
Posts: 2388
|
| Post: #4 Posted: Sat Apr 27, 2013 12:17 pm Post subject: Re: Dealing with Reversal |
|
|
Skd..
Bang on Target. Looks like you have been in the market for a long time Sir...
Good Observation of the Market....
Wish you all the Best
Regards
JT
| skd2012 wrote: | Hi Guys, hope you all are doing well! I am doing good, specially a lot better in last 15 days.
All we know that we can make money by being in the trend. It is a lot more easier to trade short or long in intraday when we know over all swing trend. However one needs to know when the trend would change a bit in advance for not getting caught in the reversal and also it helps in not fighting the trend specially in the last part of the trending move.
Different signs can tell that the trend may change in near future. We retail traders lose money in this period (5-6 days before swing trend change) by fighting the trend and when actual trend reversal happens we make lot of damage to the account. Also some get caught in the reversal sometime. Analysis on following points would help to understand things more relaxly.
Helps when NIFTY trend is maturing and reversal can happen -
1. Most inportant indicator is our self. When we think NIFTY swing trend will change based on some technical analysis like trend line, wedges, Fibo etc., it happens 5-6 days later. Monthly trend or bigger trend change happens 2-3 months later than when we think. So important is that we wait patiently in this period and trade nimble footed! Market attracts us to fight the trend in this period.
2. Some time trend reversal can be caught based on option data -
A. Sometime PCR helps along with other studies (please note we are not trying to find out exact date or level for reversal) For example 0.9-0.8 for down swing reversal and 1.2 or more for up swing reversal.
B. Many time NIFTY future would show breakout, but option value will make double top or even lower top. This is very important sign as we are option heavy market now.
C. NIFTY option OI, NF price action at highest OI strike etc.
D. In some situation NIFTY options will have premium bias to show early indication. For example on 26th April when NF was at 5910 5800 PUT traded at 57 around and 6000 CALL traded at around 52.
3. Important index stocks coming to support/resistance range specially weekly chart support/resistance, which reflects where investor has buying or selling interest. We have seen this recently when INFY tested 2200 and SBI tested sub 2000 level. This gives clear sign that market will change trend anytime soon.
4. One of the signs, when final stage of the bigger trend change happens when Dogs start running. For example when market made top at 6110, we saw Relcap, reliance, TISCO, RCOM, relinfra, bhel ran high (in reversal they fell hard).
5. Sometime global market helps to know that our market can change trend. This is specially helpful in up trending market.
6. Diverging move between BankNifty and NIFTY. Sometime Banknifty works as a leading indicator. It corrects first and then NIFTY vice versa. We get early indication from this. It does not mean that reversal from next day, just an early indication.
7. Divergence in technical indicators. This gives indication, but one needs patience here!!
8. Midcaps and small caps work as leading indicator many times. They crashes first and then NIFTY follows them. It happens in case of up move as well. I think we have 10-15 days time lag is there!
I have not stated anything new. Perhaps everybody knows about them. Perhaps I missed some points! Feel free to add them. Hope you find it interesting!
Based on above points, try to judge at what stage NIFTY up move is in now!! Excuse my English.
All the best and happy trading. |
|
|
| Back to top |
|
|
rameshraja
Expert

Joined: 24 Nov 2006
Posts: 1121
|
| Post: #5 Posted: Sat Apr 27, 2013 12:56 pm Post subject: |
|
|
Mr SKD
Its not so easy to find the turning points but exhaustion of trend can be gauged from Volume action with stone aged technical indicators. Wyckoff method of volume Analysis can help to find probable turning points though not its completely reliable.
I beg to differ with Mr Bharart view, as no single indicator or parameter or method will help you in successful trading. If its successful, then it needs to be demonstrated by Ledger balance.
In my vast trading career, success comes in trending market and its a challenging period when market moves in sideways. Advising others is very easy, but practically trading for yourself with your hard earned money is challenging and requires lot of energy to counter emotions.
In a lighter vein, best is to watch the crowd behaviour (which includes their Prowess for fabulous targets at the peak / bottom of market) is turning point for Market. Its easier to read crowd behaviour than an individual.
Best Wishes
|
|
| Back to top |
|
|
bolband_macd
White Belt
Joined: 06 Sep 2011
Posts: 104
|
| Post: #6 Posted: Sat Apr 27, 2013 1:17 pm Post subject: |
|
|
skd,
Very nice and important post. Congratulations!!
You mentioned about indicators and individual setup while taking a trading call/decision.
I could not resist myself jumping in this thread. Whatever I am saying is already known to many of us and stalwarts are following it too!!
First thing is TF (Time Frame). For an intra-day trader, Time frames from 5 TF to 30 (sometimes 60TF) are important.
Its very helpful to verify the trend by seeing these timeframes before initiating trade. For e.g. When you are about to stamp a trade in NF, watch its price action with indicators like RSI (20) and MACD. First see 5 TF --- 15 TF --- 30 TF. I am sure this will help identify you the trend....
Ok.... I know, this post is about reversal.....
Here is an interesting part.... MACD in 30 TF and 60 TF starts showing divergences. Meaning, in up-trend in these TFs , Price makes Higher High and MACD makes Lower Low or Remains Flat. Additionally, RSI (20) confirms it by entering in OB zone.
In this situation see 5TF and allow the price to break USP (Up Swing Pivot - This is explained in SSPS strategy). 5TF generally gives early indication of a reversal in intraday. One can enter in a reversal trade at this point with a proper stop-loss. Last USP breaking Red Candle (5TF) High is considered as Stop-Loss. Well, this is not a strategy but a reversal identification technique. This confirmation hardly takes time if you watch JCharts(Plus-Premium), where up-to 4 screens are visible.
Trade Safe,
BM 
|
|
| Back to top |
|
|
rk_a2003
Black Belt
Joined: 21 Jan 2010
Posts: 2734
|
| Post: #7 Posted: Sat Apr 27, 2013 5:32 pm Post subject: |
|
|
Skd,
Thanks for your post and for your efforts in compiling them together.
I would like to add one more pattern well known to Ichartians.WW pattern often indicate a trend reversal. For example look at TCS weekly chart it gave a clear reversal indication with a classical bearish ww pattern formation. One may check EOD and weekly charts for likely reversal. One more advantage here due to the high R.R is even your stop loss hit couple of times no need to bother.
I am not saying that before every reversal ww pops up. We may add this weapon too to our arsenal.
There is no easy road to success. Often I found a tendency in majority of traders to stick to very easy ways and reluctance to adapt or understand something a little complex. This is a sure way to a failure, sweat out as much as you can in a meaningful way which guarantees you success.
I can say skd post is a meaningful effort in this direction.
|
|
| Back to top |
|
|
saumya12
Brown Belt
Joined: 21 Dec 2011
Posts: 1509
|
| Post: #8 Posted: Sat Apr 27, 2013 7:12 pm Post subject: |
|
|
| Many thanks to you, SKD, for this post.
|
|
| Back to top |
|
|
rk_a2003
Black Belt
Joined: 21 Jan 2010
Posts: 2734
|
| Post: #9 Posted: Sat Apr 27, 2013 7:29 pm Post subject: |
|
|
"Advising others is very easy, but practically trading for yourself with your hard earned money is challenging and requires lot of energy to counter emotions."
Mr R.R,
What you said is absolutely correct.
"trading for yourself with your hard earned money is challenging and requires lot of energy to counter emotions."
How about finding a method /way to relieve experts from this burden? So as they can deliver beauties without a burden of spending lot of energies countering emotions.
Just a thought.
|
|
| Back to top |
|
|
ProTrader
Site Admin

Joined: 06 Jul 2008
Posts: 433
|
| Post: #10 Posted: Mon Apr 29, 2013 6:45 am Post subject: |
|
|
We are veering into a different Genre . Let's stay on SKD's intended topic.
--PT (Human with emotions)
|
|
| Back to top |
|
|
rk_a2003
Black Belt
Joined: 21 Jan 2010
Posts: 2734
|
| Post: #11 Posted: Mon Apr 29, 2013 7:59 am Post subject: |
|
|
| ProTrader wrote: | We are veering into a different Genre . Let's stay on SKD's intended topic.
--PT (Human with emotions) |
Sure PT.
|
|
| Back to top |
|
|
skd2012
Yellow Belt
Joined: 03 Oct 2012
Posts: 948
|
| Post: #12 Posted: Thu May 09, 2013 8:02 pm Post subject: |
|
|
Hi Guys,
Hope all of you are fine. This is continuation of what I posted before. I started with different signs of reversal. Now let's discuss about why it is important know about them even when we have a strategy (mechanical or non-mechanical) to initiate a trade or to exit a running one.
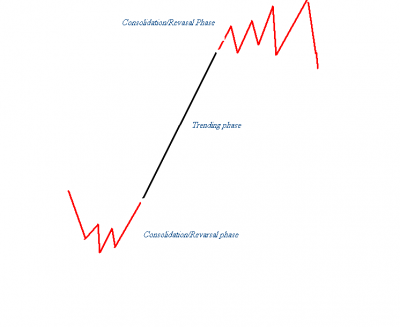
If we see market has two phases broadly in-terms of movement (both pattern and pace).
One is trending phase and 2nd one is reversal phase(sometime it can be consolidation and start of an another trending phase). I have attached a hand made chart for understanding.
As all stated,reversal/consolidation is the most challenging phase for all traders. In this phase market tends to retrace near to 100%, sometime little more and sometime little less. However it will keep making new swing highs in case of upswing reversal. We get trades 1:1 risk to reward ratio in this phase. In fact that's the max we can get in this phase irrespective of what strategy we use. Market tend to attract us for more frequent trading here and we see sudden ups and downs. In result, we have a lot of churning of money and high volume of trades. If traders are not careful, we can lose more than what we earn in trending phase.
We get all good lessons like -
1. Trade only good risk reward
2. Sitting on wining position
3. Adding position to wining position
All these do not work in reversal phase and are counter productive for traders in reversal phase. If we try to follow them in reversal phase, we will end up losing bigger money and converting wining position to a losing one. So irrespective of what trading method we use, we need to know if market is in trending phase or making a consolidating for next move. Two different approaches are needed for two different types of move.
So how we trade in reversal phase -
1. One needs to be careful around breakout trades here (exception is there, some stocks can still give good breakouts, specially one used for index management and underdogs of market, but holding them more than a day or two can be problematic).
2. Position size needs to be under control. Better to avoid adding position in this phase.
3. Quick profit booking in needed.
4. Market tends to retrace 100% (sometime little more and sometime little less), so entry after retrace is more challenging here. If we miss fine, but after missing, big no for trading on breakouts. Normally fails here.
Do all good things in trending phase of the market. As you can see, time wise trending phase is much shorter, but price movement wise it can be equivalent to consolidation phase.
Hope this make sense to you.
As far as current situation of market is concern. All I can see
1. Odd day underdogs are running -
2. PCR above 1.2
3. Odd day Bank NIFTY shows weakness.
4. Divergence is present (if I am not wrong).
5. Nature of intraday moves suggest consolidation phase (reversal or not, market needs to confirm).
6. Highest CALL OI at 6200 CE. We are little away from it.
7. Global markets rallying for sometime.
Let's see what happens next. So rally has potential to go upto 6200. Since near to all time high, if it has to breakout above it, one can not rule out wide range volatility ahead.
| Description: |
|
| Filesize: |
14.17 KB |
| Viewed: |
637 Time(s) |
|
|
|
| Back to top |
|
|
skd2012
Yellow Belt
Joined: 03 Oct 2012
Posts: 948
|
| Post: #13 Posted: Thu May 09, 2013 8:15 pm Post subject: |
|
|
bharatpatel, vinay28, Just Trade, rameshraja sir, bolband_macd, rk_a2003, saumya12, ProTrader
Thank you for your participation.
rk_a2003, I had it in my mind but forgot to write about WW. I keep forgetting many things. Not a very good writer.
rameshraja sir, Who knows better about market than you sir. Thanks for comments. Feel free to criticize if I have written anything wrong.
bharatpatel, I was to write about it which Iyou raised. I know people will wonder why should I know all these when I have a method. Tried my best to answer.
|
|
| Back to top |
|
|
skd2012
Yellow Belt
Joined: 03 Oct 2012
Posts: 948
|
| Post: #14 Posted: Sat May 11, 2013 10:43 am Post subject: |
|
|
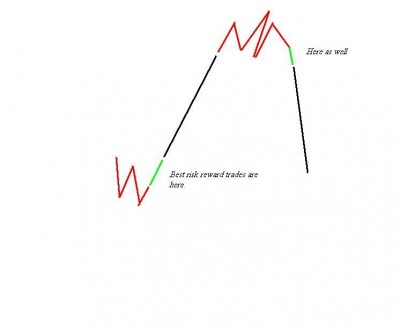
This is final thing I wanted to post on this subject. Even though consolidation and reversal throws different challenges, when it gets matured, gives us best risk reward trades when move gets reversed. I have attached a chart where, green zone gives us good risk reward trades.
By the way, my discussion is mostly for index and swing trading.
With patience if we track different signs given in the first post, and look for price destruction in option (PE in case of reversal from up side and CE in case of down move reversal), we can pick up good trades in the green zone.
Let's take current situation. As I have stated in 2nd post, we already have different signs of reversal developing currently, but scope is present up move can go to 6200 (valid for this expiry). Also we have not seen full price destruction is PUT option. If there is price destruction in PE, and market stops making new swing highs, then it will be worth to look into PE option. Also when trade goes in favor then it will worth holding on as these trades tend to give good rewards.
However we lose money as people start buying option in red zone and bear price destruction.
Hope this will help you systematically approach an option trade with good risk reward.
Note, all consolidation does not result into reversal. Sometime it will lead us to another trending move in the same direction as the previous move.
All the best.
| Description: |
|
| Filesize: |
17.75 KB |
| Viewed: |
614 Time(s) |
|
|
|
| Back to top |
|
|
bharatpatel
White Belt
Joined: 26 Oct 2011
Posts: 401
|
| Post: #15 Posted: Sat May 11, 2013 5:45 pm Post subject: |
|
|
| skd2012 wrote: | bharatpatel, vinay28, Just Trade, rameshraja sir, bolband_macd, rk_a2003, saumya12, ProTrader
Thank you for your participation.
rk_a2003, I had it in my mind but forgot to write about WW. I keep forgetting many things. Not a very good writer.
rameshraja sir, Who knows better about market than you sir. Thanks for comments. Feel free to criticize if I have written anything wrong.
bharatpatel, I was to write about it which Iyou raised. I know people will wonder why should I know all these when I have a method. Tried my best to answer. |
Dear S K D,
Nothing personal.
yes, you have correctly wrote that " why should i know all these when i have a method ".
Pls try to understand why i have posted my views in that way after your post.
- It took almost couple of years to vanish all that stuff from my mind which you have posted. (It may/can be useful for people who can understand / trade using that)
- I was bankrupt playing Call / Put of nifty using P C R. (Even i called to siddharth bhamre of angle broking , mumbai office. for clarification)
- I have paid very much high tuition fees to learn that, if you are playing stock then pls do not consider nifty's intra movement. Coz it is possible that stock u r playing may be in secular up / down trend and nifty may be in side ways movements. Latest example of this case is tatasteel (not going up) and hdfc (after a correction now near a high). If playing tisco and watching nifty what will happen we can understand.
- After self learning and luckily after subscribing to ichart i come to know that i must have to have my own trading method which suits my nature and trading style.
- After learning from shout box discussions and doing PM's to seniors i have developed my OWN trading set up which generates signals to trade. It is based on S S P S with one modification.
- Since last one year and 4 months i am regularly trading full time and profitably using my set up . (Full time means i log in at 8:45 a.m. and my trading start with USD/INR , NIFTY and it ends up at 11:30 p.m playing goldm and crude almost 14 hours a day). I play just these four instruments.
- So when i see a person talking about all these confusing stuff, first of all i refuse to accept all that bcoz of my past experience.
- Pls dont feel bad you may/are correct at your point of view and you may be a successful trader using all this. (i know it is pure and core stuff but not easily and practically and visibally apply to real time trading for average trader. it is more tuff)
- But for me it is like, when we play jindal steel we do track charts and we do not track fundamentals (though we know fundamentals also effects price movements). Just like that For me tracking price action in simplest form is enough to play any instrument and no any other confusing stuff is needed which create second thought.
Hope i have put my views in as possible as simplest wordings which can be easily understood.
Bharat.
|
|
| Back to top |
|
|
|
|
You cannot post new topics in this forum
You cannot reply to topics in this forum
You cannot edit your posts in this forum
You cannot delete your posts in this forum
You cannot vote in polls in this forum
You can attach files in this forum
You can download files in this forum
|
Powered by phpBB © 2001, 2005 phpBB Group
|
|
|


