| View previous topic :: View next topic |
| Author |
Difference in Indicator Values |
EMAMIT
White Belt

Joined: 24 Feb 2010
Posts: 20
|
Post: #1  Posted: Tue Mar 01, 2011 10:27 pm Post subject: Difference in Indicator Values Posted: Tue Mar 01, 2011 10:27 pm Post subject: Difference in Indicator Values |
 |
|
ST/PT Sir
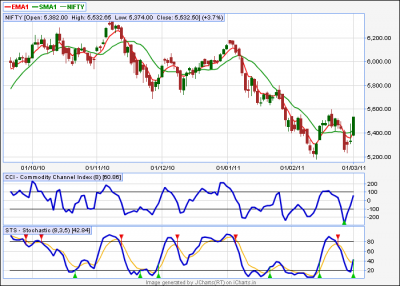
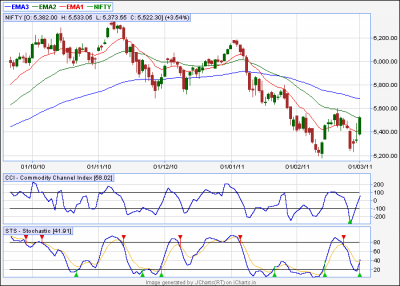
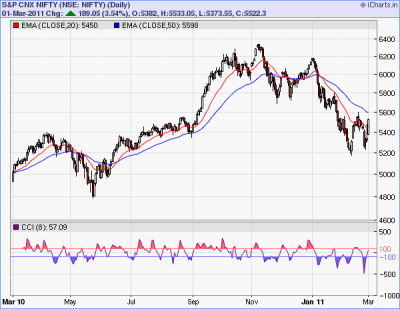
Please look at the Chart I attached here. There are difference in JCharts Premium Daily TF chart & JCharts EOD & Charts (Daily) for NIFTY when I use CCI 8 and STS 8,3,5
When I calculate these values manually using Excel Sheet STS shows same values but %D values in STS does not match with manually calculated values. Values of CCI 8 also does not match with any charts
I can understand that values of NIFTY is different for JCharts Premium and JCharts EOD. But still there is difference as below
Manually
CCI 8 = 54.09
STS 8,3,5 = 42.84
JCharts Premium
CCI 8 = 60.86
STS 8,3,5 = 42.84
JCharts EOD
CCI 8 = 58.02
STS 8,3,5 = 41.91
Charts
CCI 8 = 57.09
STS 8,3,5 = 41.91 (Slow STS %K)
In case of STS some levels does match but In case of CCI all the values are different. Will you please explain the difference.
Is there is difference in Calculation or Formula or some thing else
| Description: |
|
| Filesize: |
35.11 KB |
| Viewed: |
476 Time(s) |

|
| Description: |
|
| Filesize: |
15.86 KB |
| Viewed: |
457 Time(s) |

|
| Description: |
|
| Filesize: |
33.2 KB |
| Viewed: |
470 Time(s) |

|
| Description: |
|

Download |
| Filename: |
CCI8.xls |
| Filesize: |
143 KB |
| Downloaded: |
529 Time(s) |
|
|
| Back to top |
|
 |
|
|  |
amitkbaid1008
Yellow Belt

Joined: 04 Mar 2009
Posts: 540
|
Post: #2  Posted: Tue Mar 01, 2011 11:07 pm Post subject: Posted: Tue Mar 01, 2011 11:07 pm Post subject: |
 |
|
I can suggest one thing for CCI
Just use 0.0133333 in place of 0.015 as constant or coefficient. You will get the very same values as displayed by Chart posted by you or alternatively you can multiply the values calculated by you in Excel by 1.125
|
|
| Back to top |
|
 |
ProTrader
Site Admin

Joined: 06 Jul 2008
Posts: 433
|
Post: #3  Posted: Wed Mar 02, 2011 5:34 am Post subject: Posted: Wed Mar 02, 2011 5:34 am Post subject: |
 |
|
EMAMIT:
Please check the OHLC values on the chart snapshot you have posted and you will know why it is different. When you are using Premium or Basic charts in Intraday mode (before the EOD data is updated from Bhavcopy), there will always be a difference in values compared to JCharts(EOD).
Intraday OHLC may differ from EOD OHLC.
Hope this clarifies the issue.
Thanks,
Detective PT 
|
|
| Back to top |
|
 |
EMAMIT
White Belt

Joined: 24 Feb 2010
Posts: 20
|
Post: #4  Posted: Wed Mar 02, 2011 11:58 am Post subject: Posted: Wed Mar 02, 2011 11:58 am Post subject: |
 |
|
Thanks PT Sir for your reply. Agreed with your explanation, but why there is difference between my calculated values and values shown in charts even if we take EOD OHLC values.
Whether there is need to change the constant from 0.015 to 0.013333 as everyone knows that constant for CCI is always 0.015 and its not like parameter value which can be changed like we change in Parabolic SAR
|
|
| Back to top |
|
 |
|
|
You cannot post new topics in this forum
You cannot reply to topics in this forum
You cannot edit your posts in this forum
You cannot delete your posts in this forum
You cannot vote in polls in this forum
You can attach files in this forum
You can download files in this forum
|
Powered by phpBB © 2001, 2005 phpBB Group
|
|

