| View previous topic :: View next topic |
| Author |
donchains channel and ema high low plan |
svkum
White Belt

Joined: 14 Feb 2007
Posts: 321
|
Post: #1  Posted: Tue Aug 02, 2011 2:10 am Post subject: donchains channel and ema high low plan Posted: Tue Aug 02, 2011 2:10 am Post subject: donchains channel and ema high low plan |
 |
|
for finding the trend , and locating reversal of trend in trending mkt lets have following strategy .
1)in livecharts premium- plot 13 ema high, and 13 ema low
2)select 60 mts tf (you can test this for 30 tf )
3)plot donchains channels , but for period of 7( and not 20 as its there by dafault)
for upmove
1) price to cross 13ema high from down to up
2)donchains channels-rates to cross last high9flattish shape to cross) , till the channel cross and lowers last low(flattish shape to cross), and
3)rates to cross 13 ema low
SL to be donchains channels lower band levels.
likewise plan shd be made for downmove.
i am trying to put livecharts images here ,till now getting success.
svkum
|
|
| Back to top |
|
 |
|
|
 |
svkum
White Belt

Joined: 14 Feb 2007
Posts: 321
|
Post: #2  Posted: Tue Aug 02, 2011 2:12 am Post subject: Posted: Tue Aug 02, 2011 2:12 am Post subject: |
 |
|
| till now NOT getting success , shd be read
|
|
| Back to top |
|
 |
SwingTrader
Site Admin
Joined: 11 Aug 2006
Posts: 2903
Location: Hyderabad, India
|
Post: #3  Posted: Tue Aug 02, 2011 8:54 am Post subject: Posted: Tue Aug 02, 2011 8:54 am Post subject: |
 |
|
| svkum wrote: | | till now NOT getting success , shd be read |
Here is how to do it....right click on the chart (live charts) and select "Save Image As...", change the file name to whatever you want (the file extension must be .PNG only). Then in the forum while posting a message select the file in "Add an Attachment" section and click "Add Attachment" button. Then submit the post.
Regards.
_________________
Srikanth Kurdukar
@SwingTrader |
|
| Back to top |
|
 |
opportunist
White Belt

Joined: 27 Apr 2010
Posts: 356
|
Post: #4  Posted: Tue Aug 02, 2011 9:04 am Post subject: Re: donchains channel and ema high low plan Posted: Tue Aug 02, 2011 9:04 am Post subject: Re: donchains channel and ema high low plan |
 |
|
| svkum wrote: | for finding the trend , and locating reversal of trend in trending mkt lets have following strategy .
1)in livecharts premium- plot 13 ema high, and 13 ema low
2)select 60 mts tf (you can test this for 30 tf )
3)plot donchains channels , but for period of 7( and not 20 as its there by dafault)
for upmove
1) price to cross 13ema high from down to up
2)donchains channels-rates to cross last high9flattish shape to cross) , till the channel cross and lowers last low(flattish shape to cross), and
3)rates to cross 13 ema low
SL to be donchains channels lower band levels.
likewise plan shd be made for downmove.
i am trying to put livecharts images here ,till now getting success.
svkum |
Thanks Svkum Sir for trying to explain your strategy. However, kindly elaborate on points 2 and 3 with some examples as I could not get the meaning exactly.
Regards,
Opportunist
|
|
| Back to top |
|
 |
drsureshbs
White Belt

Joined: 22 Oct 2008
Posts: 58
|
Post: #5  Posted: Fri Aug 05, 2011 12:14 am Post subject: Posted: Fri Aug 05, 2011 12:14 am Post subject: |
 |
|
| Svkum sir i am just waiting hoping u wl add more to it
|
|
| Back to top |
|
 |
amitkbaid1008
Yellow Belt

Joined: 04 Mar 2009
Posts: 540
|
Post: #6  Posted: Fri Aug 05, 2011 12:58 am Post subject: Posted: Fri Aug 05, 2011 12:58 am Post subject: |
 |
|
SVKUM Sir,
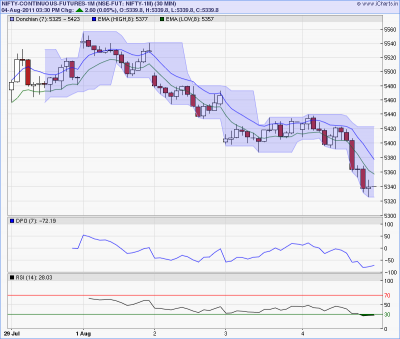
I have attached chart of NIFTY-1M with your suggested setup.
Please elaborate your strategy now with chart.
Thanx
| Description: |
|
| Filesize: |
56.94 KB |
| Viewed: |
790 Time(s) |

|
|
|
| Back to top |
|
 |
svkum
White Belt

Joined: 14 Feb 2007
Posts: 321
|
Post: #7  Posted: Fri Aug 05, 2011 6:52 am Post subject: Posted: Fri Aug 05, 2011 6:52 am Post subject: |
 |
|
extension to the theory.
| Description: |
|
| Filesize: |
55.84 KB |
| Viewed: |
719 Time(s) |

|
|
|
| Back to top |
|
 |
svkum
White Belt

Joined: 14 Feb 2007
Posts: 321
|
Post: #8  Posted: Fri Aug 05, 2011 7:47 am Post subject: Posted: Fri Aug 05, 2011 7:47 am Post subject: |
 |
|
dear AMIT,
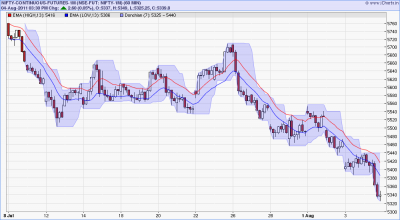
9TH JULY ,NF crosses 13ema low and dc in lower band at 5680
13th july,nf crossing 13 ema high, also at that level dv flat line also breaks upwards, pl see the upper edge of channel
here gain is 80 points.
see on 26 july 13 ema low crosses downside at 5600, also channel edge also crosses downward, now on 1st aug nf crosses 13 ema high at 5540, also channel edge moves upward .
here gain is 60 points.
on 2nd aug at 5480 , nf breaks down 13 ema low ,also channel edge is moving below .till now it has not crossed 13 ema high , nor channel edge crossing above earler flattish edge ,
here one can book profit 140 points.
in this system gain is curtailed , bcz we are waiting for nf to cross 13 ema high and channel shape also .
otherwise one can book partail profit at lower point , and book fuul profit at cross above 13 emahigh.
as stated earlier channel upper edge in down move of nf should be taken as sl.
hope now all is clear.
i will explain with more examples , with stocks , after i gain experiance of placing images on forum.
|
|
| Back to top |
|
 |
svkum
White Belt

Joined: 14 Feb 2007
Posts: 321
|
Post: #9  Posted: Fri Aug 05, 2011 7:53 am Post subject: Posted: Fri Aug 05, 2011 7:53 am Post subject: |
 |
|
i have posted nf chart with 30mtf
this seems to be very close affair
we require extreame trending chart for lower timeframe to be more gainful
|
|
| Back to top |
|
 |
svkum
White Belt

Joined: 14 Feb 2007
Posts: 321
|
Post: #10  Posted: Fri Aug 05, 2011 8:13 am Post subject: Posted: Fri Aug 05, 2011 8:13 am Post subject: |
 |
|
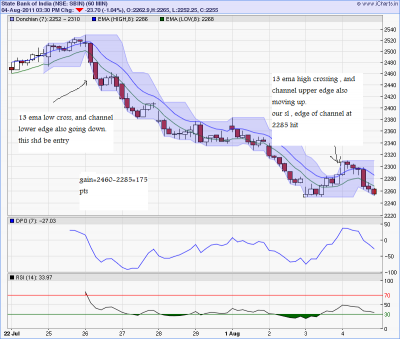
see the attachment for SBI , which is having strong trending pattern .
we need to locate such type of stocks to ,apply the 13 ema high ,low and DC theory.
| Description: |
|
| Filesize: |
59.19 KB |
| Viewed: |
926 Time(s) |

|
|
|
| Back to top |
|
 |
svkum
White Belt

Joined: 14 Feb 2007
Posts: 321
|
Post: #11  Posted: Fri Aug 05, 2011 8:16 am Post subject: Posted: Fri Aug 05, 2011 8:16 am Post subject: |
 |
|
sorry , here i have taken 8 ema high ,low instead of 13 ema high and low.
however 13 ema also can be applied , with same effect.
|
|
| Back to top |
|
 |
opportunist
White Belt

Joined: 27 Apr 2010
Posts: 356
|
Post: #12  Posted: Fri Aug 05, 2011 11:09 am Post subject: Posted: Fri Aug 05, 2011 11:09 am Post subject: |
 |
|
Dear Svkum Sir,
You said:
2)donchains channels-rates to cross last high9flattish shape to cross) , till the channel cross and lowers last low(flattish shape to cross), and
3)rates to cross 13 ema low
Kindly explain the term 'rates'. Also point number 2 above may be please elaborated upon.
Regards,
Opportunist
|
|
| Back to top |
|
 |
opportunist
White Belt

Joined: 27 Apr 2010
Posts: 356
|
Post: #13  Posted: Fri Aug 05, 2011 11:17 am Post subject: Posted: Fri Aug 05, 2011 11:17 am Post subject: |
 |
|
| svkum wrote: | see the attachment for SBI , which is having strong trending pattern .
we need to locate such type of stocks to ,apply the 13 ema high ,low and DC theory. |
Dear Svkum sir,
Please ignore my earlier post. I have understood what you meant from the SBI chart itself. Only question I have now is did you pre-calculate 2285 as the SL or decided that this was the SL when it hit 2285 upper flat on DC with a red candle ?
Regards,
Opportunist
|
|
| Back to top |
|
 |
svkum
White Belt

Joined: 14 Feb 2007
Posts: 321
|
Post: #14  Posted: Fri Aug 05, 2011 6:51 pm Post subject: Posted: Fri Aug 05, 2011 6:51 pm Post subject: |
 |
|
OPPOURTUNIST,
NO its not predecided, as i stated earlier , sl to be (OR TSL) always channels upper /lower edge or last flat shape as the case may be , this has to be changed daily. and whenever this sl get hit , its presumed to have trend changing sign.
|
|
| Back to top |
|
 |
opportunist
White Belt

Joined: 27 Apr 2010
Posts: 356
|
Post: #15  Posted: Fri Aug 05, 2011 8:15 pm Post subject: Posted: Fri Aug 05, 2011 8:15 pm Post subject: |
 |
|
| svkum wrote: | OPPOURTUNIST,
NO its not predecided, as i stated earlier , sl to be (OR TSL) always channels upper /lower edge or last flat shape as the case may be , this has to be changed daily. and whenever this sl get hit , its presumed to have trend changing sign. |
thanks for the clear explanation
rgds
oppo
Last edited by opportunist on Fri Aug 05, 2011 11:16 pm; edited 1 time in total |
|
| Back to top |
|
 |
|

