| View previous topic :: View next topic |
| Author |
ELLIOTT WAVE ANALYSIS |
kiran.jain
White Belt

Joined: 31 Jan 2008
Posts: 47
Location: mumbai
|
Post: #16  Posted: Tue May 20, 2008 4:10 pm Post subject: Posted: Tue May 20, 2008 4:10 pm Post subject: |
 |
|
hello guys..... so 2day(20/05/2008) we completed wave iv..... so what would be target for wave v????
regards
|
|
| Back to top |
|
 |
|
|
|
swaroopbn
White Belt
Joined: 12 Feb 2008
Posts: 39
|
| Post: #17 Posted: Wed May 21, 2008 9:34 am Post subject: EW - 21/05/2008 |
|
|
Dow had a massive fall overnight - ppl who are sitting on Nifty short will get another chance to exit and lock good profits today. However Asia mkt is resilient today - HSI, Straits and Taiwan are posting moderate losses anywhere between -0.5% to -1.0%. Let's see what Elliot is in store for us. We are heading down - but how much more 
Please find below the latest Nifty snapshot
So what we see - we are precisely in minute wave iv. This minute wave iv promised to be in a-b-c form. Y'day we completed a and b. And during today opening we will see c. Big question now - what will be c low 
There are 2 options
1) Considering iii completion at 5265, iv won't get into i territory. Hence iv low > 5065 (i high)
2) Considering iii still in progress, iv will retrace below 5065 and peak at 5013 - normally c is 1.62xa hence c = 5166.65 - ((5166.65-5072.75)*1.62) = 5013
In both the cases 5010 is saved 
In short watch out the levels 5065/5013 for today.
Happy trading 
|
|
| Back to top |
|
|
E200105
White Belt
Joined: 29 Oct 2007
Posts: 1
|
| Post: #18 Posted: Wed May 21, 2008 9:43 am Post subject: EW analysis for 21st may |
|
|
| The explanation is quite superb.
|
|
| Back to top |
|
|
mayurnsk
Moderator
Joined: 18 Jan 2007
Posts: 216
Location: Nasik, Maharashtra
|
| Post: #19 Posted: Wed May 21, 2008 10:15 am Post subject: |
|
|
Hi swaroop
Good morning
Nice post and good explaination. Right in approch.
Regards
Mayuresh Jahagirdar
Nasik
Maharashtra
|
|
| Back to top |
|
|
vetrivel
White Belt
Joined: 23 Jul 2007
Posts: 20
|
| Post: #20 Posted: Thu May 22, 2008 5:18 pm Post subject: |
|
|
hi mayur,
Good initiative and good understandable flow.
Thanks and good wishes,
with Love & Regards,
Vetrivel
|
|
| Back to top |
|
|
kiran.jain
White Belt
Joined: 31 Jan 2008
Posts: 47
Location: mumbai
|
| Post: #21 Posted: Thu May 22, 2008 5:49 pm Post subject: |
|
|
hmmmmm......
so iv did in a-b-c manner......
what would b tgt of v?? say in both case....... 12345 or direct... 
regards
|
|
| Back to top |
|
|
pradyehv
White Belt
Joined: 09 Jan 2007
Posts: 43
|
| Post: #22 Posted: Thu May 22, 2008 7:01 pm Post subject: |
|
|
Swaroop,
Very nice analysis. Thanks.
|
|
| Back to top |
|
|
swaroopbn
White Belt
Joined: 12 Feb 2008
Posts: 39
|
| Post: #23 Posted: Fri May 23, 2008 1:48 am Post subject: EW - 23/05/2008 |
|
|
Hmm... So it's working 
EW level 5010 was rock solid atleast for today ....
Now some food for though - based on nifty's retracement i am changing the minor/sub waves a little bit
Please refer the chart below
Just to reiterate we are in sub/minute wave 5 of Wave 3. In that wave 5 we have completed wave i and ii in in progress (or over at 5010 today).
The wave i completed in 1-2-3-4-5 fashion. After i we are undergoing ii in a-b-c fashion.
a: 5166-5048
b: 5048-5135
c: 5135-5013 (or may be max till 4974 - funda applies here too c=1.62a)
After c completion i would consider corrective wave ii will be over and iii will start.
Now the big question tgt for iii
Ideally iii = golden ratio X wave i
Going by that rule iii completion will happen at 4915+1.62x(5167-4915)= 5322
Wow - that'z a good number 
Tgt - 5322
Support - 4974
Will be able to post more on support/target levels once iii starts. Just one thing iii if it happens will happen very fast and reach it's target quickly.... because iii is the wildest impulse wave
Happy trading
Swaroop
Hyderabad
Disclaimer: This analysis is done by me based on my little knowledge on EW. Please do your own analysis before taking a trading call.
|
|
| Back to top |
|
|
santoshkpai
White Belt
Joined: 29 Feb 2008
Posts: 6
|
| Post: #24 Posted: Fri May 23, 2008 2:20 am Post subject: EW analysis |
|
|
Dear Swaroop,
It is a GREAT initiative, I guess such a great science (EW), unless propogated by yourself and BABA will not get its due recognition.
The best part of your posting has been the graphical use of presentation, which makes it a whole lot easier to grasp and REGISTER. I understand that the KEY to grasping this concept is numbering the WAVE, probably if you guys continue this efforts, all boarders would latch on and we can then have a BIG EW COMMUNITY.
At this point, I have one question for u, do u use a 30min tick for the graphs or 60min.
Kudos.
Best regards
Santosh K.Pai
|
|
| Back to top |
|
|
stockscasino
White Belt
Joined: 12 Mar 2008
Posts: 7
|
| Post: #25 Posted: Fri May 23, 2008 8:32 am Post subject: EWT |
|
|
| Good effort to let us all know about that sir.
|
|
| Back to top |
|
|
mayurnsk
Moderator
Joined: 18 Jan 2007
Posts: 216
Location: Nasik, Maharashtra
|
| Post: #26 Posted: Sat May 24, 2008 1:03 pm Post subject: GEOWAVE- Advanced Elliot wave |
|
|
WELCOME TO EXCITING WORLD OF GEOWAVE
Is price movement in the stock market the result of unpredictable and random news and events? No, it isn’t, and we can prove it. Price follows a determined and predictable path based on changes in social mood. This path is predicted by objectively applying GeoWave Analysis to the stock market. That’s what we do here at Geowave, using the model to forecast the near, mid, and long-term direction of the major markets; and it works.With Geowave we have time and again made miraculous market forecasts which has helped traders in increasing their bottomline exponentially.
Geowave is the scientific enhancement of orthodox Elliott Wave theory with the help of mathematical models and modern techniques.As a result we have successfully eliminated the biggest drawback of Elliott wave theory and i.e. the element of Subjectivity.The Geowave Model also considers the factor of chaos which has never been incorporated in any trading system of the world.These are some of the features that differentiates Geowave from any other tool available in the financial world.We at Geowave have now started our services in India after successfully guiding over 400 traders in the United States.
In Indian markets our focus lies on the Nifty Index which has seen quite a meltdown from January 2008 and is now trading in a range but the question which lingers in the mind of every trader is that will this range breakout in the near future or not !!!,apart from this a big question which haunts not only traders but also investors is that what will be the direction of breakout if it does break the range.We at Geowave boast of forecasting not only the market direction in near future but also over medium to long term on the basis of our superior technolgy and reliable indicators such as the 'M' wave factor.These are the techniques which one will never learn or hear in ordinary technical analysis and as a result the consequence is but obvious.Poor Techniques lead to poor Results thereby decreasing the bottomline in a substantial way.So Stop wasting time and money chasing the markets. Whether you are a positional nifty trader, part-time investor, money manager, or institution, GeoWave will add significant value where it matters – your bottom line. Come Join the Geowave Family.
http://www.geowave.net
I am posting this link purposely because it is something new in elliot wave analysis one must know. Not being advertising it here or such. This is not the place to do so
Regards
Mayuresh Jahagirdar
Nasik
Maharashtra
| Description: |
|
| Filesize: |
99.29 KB |
| Viewed: |
637 Time(s) |
|
Last edited by mayurnsk on Sat May 24, 2008 7:00 pm; edited 2 times in total |
|
| Back to top |
|
|
mayurnsk
Moderator
Joined: 18 Jan 2007
Posts: 216
Location: Nasik, Maharashtra
|
| Post: #27 Posted: Sat May 24, 2008 6:49 pm Post subject: |
|
|
Hi Ichartians
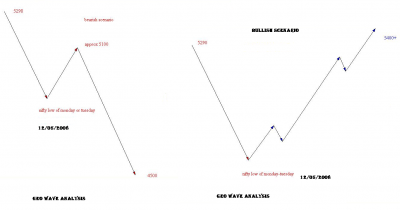
Here is what advanced geowave analysis is saying , its called geowave analysis.
The nifty might bottom out at 4880 and rebound till 5050 plus levels. Then will again fall.
Check the picture
Regards
Mayuresh Jahagirdar
Nasik
Maharashtra[/code]
| Description: |
|
| Filesize: |
375.86 KB |
| Viewed: |
647 Time(s) |
|
|
|
| Back to top |
|
|
mayurnsk
Moderator
Joined: 18 Jan 2007
Posts: 216
Location: Nasik, Maharashtra
|
| Post: #28 Posted: Mon May 26, 2008 1:45 am Post subject: |
|
|
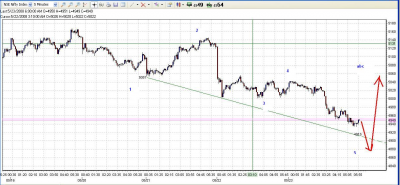
Hi all
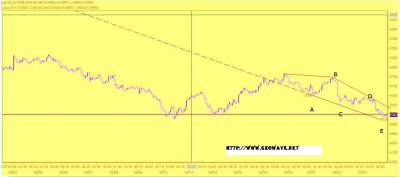
In addition to above post, posting EOD pic of Nifty. This as per geowave.net
Mayuresh Jahagirdar
Nasik
Maharashtra
| Description: |
| THIS PICTURE IS AS PER GEOWAVE |
|
| Filesize: |
326.3 KB |
| Viewed: |
605 Time(s) |
|
|
|
| Back to top |
|
|
marne.vivek
White Belt
Joined: 11 Apr 2008
Posts: 244
Location: Pune / Mumbai
|
| Post: #29 Posted: Thu May 29, 2008 5:03 pm Post subject: 29 may 15 min charts |
|
|
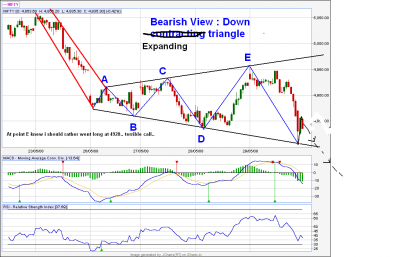
Hey based on my analysis of Elliott Wave Expanding triangle, posting two charts, like which of the wave count to be considered..
Pls reply
PS there was error in previous file name, its Expanding Triangle.
| Description: |
|
| Filesize: |
50.16 KB |
| Viewed: |
577 Time(s) |
|
| Description: |
|
| Filesize: |
51.74 KB |
| Viewed: |
579 Time(s) |

|
_________________
Vivek |
|
| Back to top |
|
|
mayurnsk
Moderator
Joined: 18 Jan 2007
Posts: 216
Location: Nasik, Maharashtra
|
| Post: #30 Posted: Fri May 30, 2008 7:33 pm Post subject: |
|
|
Hi
Vivek
Nice that you are picking up some of Elliott wave. nice to see that. The second picture is more possible.
Just keep it up.
Regards
Mayuresh Jahagirdar
Nasik
Maharashtra
Last edited by mayurnsk on Thu Jun 05, 2008 11:17 pm; edited 1 time in total |
|
| Back to top |
|
|
|


