| View previous topic :: View next topic |
| Author |
ELLIOTT WAVE ANALYSIS |
gudd007
White Belt

Joined: 30 May 2008
Posts: 39
|
Post: #31  Posted: Thu Jun 05, 2008 10:08 pm Post subject: Posted: Thu Jun 05, 2008 10:08 pm Post subject: |
 |
|
Sirji pehle Elliott ki spelling to theek se likho.
Phir Charts par apna confusion label karna.
|
|
| Back to top |
|
 |
|
|
|
mayurnsk
Moderator
Joined: 18 Jan 2007
Posts: 216
Location: Nasik, Maharashtra
|
| Post: #32 Posted: Thu Jun 05, 2008 11:19 pm Post subject: |
|
|
gudd007
Hi sirji.
Thank you for showing out the mistake. Sirji we are novices trying to bring masters out in forum. If you know good oabout elliott wave analysis then do contribute.
Mayuresh Jahagirdar
Nasik
Maharashtra
|
|
| Back to top |
|
|
gudd007
White Belt
Joined: 30 May 2008
Posts: 39
|
| Post: #33 Posted: Fri Jun 06, 2008 7:14 pm Post subject: |
|
|
Sirji,no one is master,no one can be.Har din naya master aata hai,har mahine.
Everyone has a level,its not the level, but how you trade the level that matters.
There are things more simpler than EW for trading.
They say if you put 12 EWavers in a room,all of them will come up with different counts.
|
|
| Back to top |
|
|
marne.vivek
White Belt
Joined: 11 Apr 2008
Posts: 244
Location: Pune / Mumbai
|
| Post: #34 Posted: Thu Jun 12, 2008 10:36 pm Post subject: Wave count |
|
|
Once again i am testing my Elliott knowledge.
Posting wave count..
according to me, we were till now in wave 3 of major wave C, which we have shifted to wave 4 in major C.
Elliottians, pls correct me if i am wrong..
| Description: |
|
| Filesize: |
52.59 KB |
| Viewed: |
667 Time(s) |
|
_________________
Vivek |
|
| Back to top |
|
|
balraj167
White Belt
Joined: 16 Jun 2008
Posts: 15
|
| Post: #35 Posted: Mon Jun 16, 2008 2:47 pm Post subject: hi mayuresh |
|
|
hi Mayuresh thanks for your post and keep it up today i ready the both sites
Thanks
Balram Naidu
|
|
| Back to top |
|
|
mayurnsk
Moderator
Joined: 18 Jan 2007
Posts: 216
Location: Nasik, Maharashtra
|
| Post: #36 Posted: Tue Jun 17, 2008 1:37 am Post subject: |
|
|
marne.vivek hi
hey dude you are doing great 
righto!!!
Mayuresh Jahagirdar
Nasik
Maharastra
|
|
| Back to top |
|
|
marne.vivek
White Belt
Joined: 11 Apr 2008
Posts: 244
Location: Pune / Mumbai
|
| Post: #37 Posted: Tue Jun 17, 2008 1:35 pm Post subject: @ mayur |
|
|
hi mayur,
thanks for the encouragement.
will keep the practice on.
thanks,
_________________
Vivek |
|
| Back to top |
|
|
marne.vivek
White Belt
Joined: 11 Apr 2008
Posts: 244
Location: Pune / Mumbai
|
| Post: #38 Posted: Thu Jun 19, 2008 11:38 pm Post subject: |
|
|
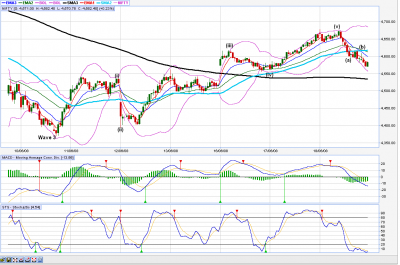
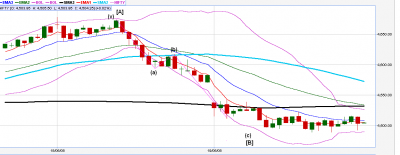
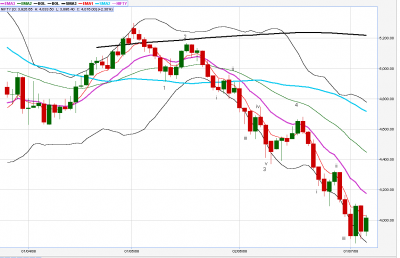
Under yesterday's post at "Market Direction > Nifty Analysis" i had tried to giving wave count where Wave A of Wave C4 ended, continuing with that i give further wave count for wave B in wave C4.
Data used: 15 Min candle sticks
Purple band: Bollinger Band
50 SMA : Light Blue Thick Line
200 SMA: Black line
Wave (a) in wave C-4-B ended at point 18-6-08 13.45 at point 4595.
Wave (b) in Wave C-4-B which should ideally retrace 23.60% ended at 18-6-08 14.30 candle , opening at 4613.50, which apparently is 2.6% retracement of wave a in wave C-4-B and marking a high of 4617.
From where we commenced wave c in wave C-4-B, which should be equivalent to lenght of wave (a), which would be 4539, been the ideal target of wave (c) in wave C-4-B. But it got extended considering the fact that markets are markets so Smile that be it.
Now the inverted H & S that i see, should mark the beginning of wave (C) in C4, which i donot expect to cross more than 4674, may contain triangle or sideway movement, which can make nifty drift sideways and then push to start of wave C-5.
Elliottians on icharts, pls correct me if i am wrong.
Regards
Vivek
PS Earlier Wave Count attached as well do correct me if i am wrong.
| Description: |
| Wave Count on 18 June 2008 |
|
| Filesize: |
66.22 KB |
| Viewed: |
599 Time(s) |
|
| Description: |
|
| Filesize: |
27.89 KB |
| Viewed: |
577 Time(s) |
|
|
|
| Back to top |
|
|
marne.vivek
White Belt
Joined: 11 Apr 2008
Posts: 244
Location: Pune / Mumbai
|
| Post: #39 Posted: Sat Jun 21, 2008 8:43 am Post subject: Nifty Wave Count |
|
|
(my earlier counts based on intrday charts were incorrect, got it clarified, i hope this one is not)
Hi all,
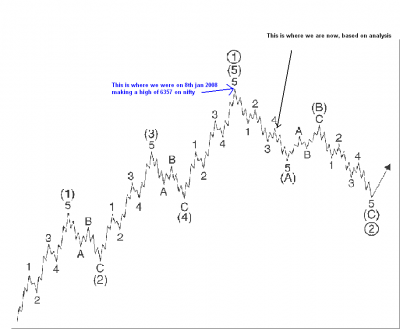
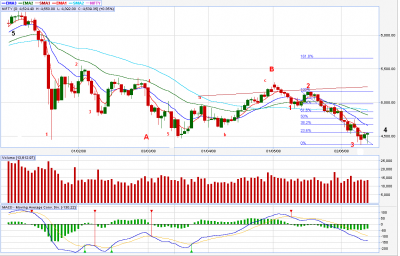
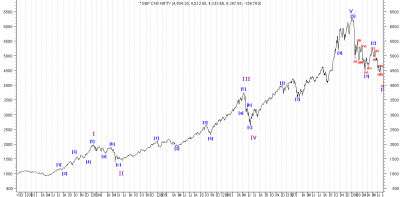
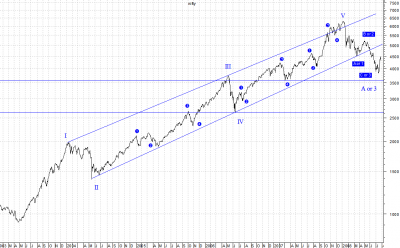
Based on working by me and my friend Prasad Rajamane, we put forth the nifty wave count from start that is from start of wave 1 till date for consideration.
Further, in chart two we present that we are not in pattern B or C.
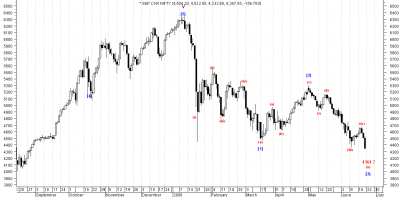
We are still in Intermediate Wave A. We completed Intermediate wave 5 on 8th jan at high of 6357, from where we started the move to Intermediate Wave A
Based on our knowledge, we consider need to make 5 waves to complete wave A. Of which we have completed 4 waves and from 18 june 2008 entered into wave 5 (these are marked on the chart).
We expect nifty to make bottom at 4164 to 4194, in next two days and mark completion of Intermediate wave A, from where it can start bounce up to wave B and then once that is completed to Wave C.
Elliotticians pls do comment..
Regards
Vivek & Prasad
| Description: |
|
| Filesize: |
54.65 KB |
| Viewed: |
589 Time(s) |
|
| Description: |
|
| Filesize: |
56.86 KB |
| Viewed: |
627 Time(s) |
|
|
|
| Back to top |
|
|
marne.vivek
White Belt
Joined: 11 Apr 2008
Posts: 244
Location: Pune / Mumbai
|
|
| Back to top |
|
|
mayurnsk
Moderator
Joined: 18 Jan 2007
Posts: 216
Location: Nasik, Maharashtra
|
| Post: #41 Posted: Sat Jun 21, 2008 8:16 pm Post subject: |
|
|
H! marne.vivek
Doing great job. keep going and be ready for critics
Mayuresh Jahagirdar
Nasik
Maharashtra
|
|
| Back to top |
|
|
sanmen
White Belt
Joined: 28 Apr 2008
Posts: 88
Location: Delhi
|
| Post: #42 Posted: Sun Jun 22, 2008 12:50 am Post subject: |
|
|
Vivek:
I have one observation based on the book that i am reading and even the ref chart that you have posted from your book...
According to the book the retracement A-B-C should not be lower then the bottom of Wave 4 (towards the upside)...if we follow this then we should have this correction going till 4000 levels approx...its important that we establish the levels of 1 - 2 - 3 - 4 -5 clearly before we arrive at a consensus on this front..please have a relook on this..
If this is the case then we are thru with A and B and are in the last wave of C i.e. C5 which should extend nearly till 4000 and then start a fresh..
Ramtrade sir: i guess our discussion also reflects from the chart that you have posted...this bull wave started from 2004 which you have taken into account..methods might be different i guess we have a consensus building here...thanx for your post..
Elliotticians: please help with your much needed contribution..
rgds
Sandeep
|
|
| Back to top |
|
|
ramtrade
White Belt
Joined: 17 Oct 2007
Posts: 36
|
| Post: #43 Posted: Mon Jun 30, 2008 10:31 pm Post subject: Hi |
|
|
Hi,
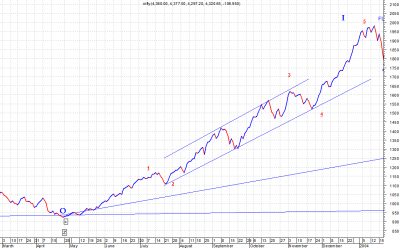
EW is too subjective. As Guddie said if we bring in ellioticians into a room each one will have a different count. From my perspective, the count which majority of us have as the completion of wave 5 in Jan 2008, what if that's the end of wave '3'? I am only looking at the alternate counts....Should the end of the major waves touch the channel? If yes, then should'nt the end of wave 1 and wave 3 and 5 touch the upper channel.....?
If we were to consider Jan peak as the completion of wave 5 then did all one and 3 touch the upper channel?
Thanks
Ramesh
|
|
| Back to top |
|
|
marne.vivek
White Belt
Joined: 11 Apr 2008
Posts: 244
Location: Pune / Mumbai
|
| Post: #44 Posted: Fri Jul 04, 2008 11:16 pm Post subject: |
|
|
wave count..
do correct me..
| Description: |
|
| Filesize: |
44.9 KB |
| Viewed: |
596 Time(s) |
|
_________________
Vivek |
|
| Back to top |
|
|
marne.vivek
White Belt
Joined: 11 Apr 2008
Posts: 244
Location: Pune / Mumbai
|
| Post: #45 Posted: Mon Jul 28, 2008 6:43 pm Post subject: The NIFTY ELLIOT WAVE ANALYSIS |
|
|
hi all,
i was working on nifty wave counts from the beginning of present bull run to the recent low.
i tried to write here, but its is diifcult to post the table, etc, so have made a word file with the working and all daigrams.
Further i am attaching the Pictures of the waves for better view.
Do read and give your comments,
regards
| Description: |
|
| Filesize: |
29.56 KB |
| Viewed: |
577 Time(s) |
|
| Description: |
|
| Filesize: |
28.17 KB |
| Viewed: |
598 Time(s) |
|
| Description: |
|

Download |
| Filename: |
NIfty Elliott Wave Commentary.doc |
| Filesize: |
540.5 KB |
| Downloaded: |
650 Time(s) |
_________________
Vivek |
|
| Back to top |
|
|
|