|
|
| View previous topic :: View next topic |
| Author |
ELLIOTT WAVE ANALYSIS |
mayurnsk
Moderator
Joined: 18 Jan 2007
Posts: 216
Location: Nasik, Maharashtra
|
Post: #1  Posted: Sat May 10, 2008 12:15 am Post subject: ELLIOTT WAVE ANALYSIS Posted: Sat May 10, 2008 12:15 am Post subject: ELLIOTT WAVE ANALYSIS |
 |
|
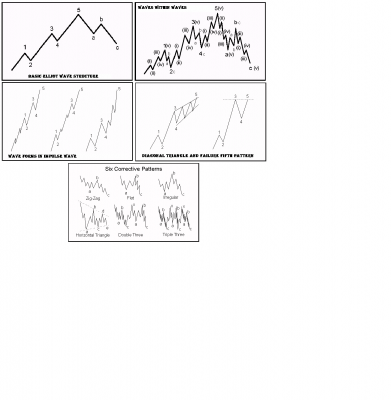
Collected Rules and Guide lines for proper elliott wave interpretation
Its a biggie .Little difficult to read but worthwile
SEE AT THE BOTTOM FOR PICTURES OF WAVE FORMS
Impulse Rules:
An Impulse is a five Wave pattern labeled 1-2-3-4-5 moving in the direction of the larger trend. It is the most common Elliott Wave pattern.
Wave 1 must be an Impulse or a Leading Diagonal.
Wave 2 may be any corrective pattern except a Triangle.
No part of Wave 2 can more than retrace Wave 1.
Wave 2 must retrace Wave 1 by a minimum of 20%.
The maximum time for Wave 2 is nine times Wave 1.
Wave 3 must be an Impulse.
Wave 3 must be longer than Wave 2 in gross distance by price.
The gross price movement of Wave 2 must be greater than either Wave 2 of Wave 1 or Wave 4 of Wave 1. The gross price movement of Wave 2 must also be greater than either Wave 2 of Wave 3 or Wave 4 of Wave 3. Wave 2 must also be greater than 61.8% of the gross movement of each of the above 4 sub-Waves.
Wave 3 and Wave 1 cannot both have 5th Wave failures. (A Failure is an impulsive Wave where Wave 5 is shorter than Wave 4 by price.)
Wave 3 cannot be less than 1/3 of Wave 1 by price.
Wave 3 cannot be more than 7 times Wave 1 by price.
Although there is no minimum time constraint for Wave 3, its absolute maximum time limit is 7 times Wave 1.
Wave 4 can be any corrective pattern.
Waves 1, 2 and 4 cannot overlap except by 15% of Wave 2 with leveraged securities, and then only for a maximum of less than two days.
The gross price movement of Wave 4 must be greater than either the gross movement of Wave 2 of 3 or Wave 4 of 3. The gross price movement of Wave 4 must also be greater than either the gross movement of Wave 2 of 5 or Wave 4 of 5. The gross movement by price of Wave 4 must also be greater than 61.8% of the gross movement of each of these four subwaves.
The gross movement by price of Wave 4 must be greater than 1/3 of the gross movement of Wave 2 by both price and percentage movement.
The gross movement by price for Wave 4 must be less than three times the gross movement of Wave 2 by both price and percentage movement.
Wave 3 and Wave 4 cannot both be failures. (A Failure is an impulsive Wave where Wave 5 is shorter than Wave 4 by price.)
Although Wave 4 has no minimum time constraint, the maximum time for Wave 4 is twice the time taken by Wave 3.
Wave 5 must be an Impulse or an Ending Diagonal. However, if Wave 5 is longer than Wave 3 by price, then Wave 5 must be an Impulse.
Wave 5 must move by price more than 70% of Wave 4. (This is not gross movement. Only consider the end points of both Waves.)
Wave 3 must never be shorter than both Wave 1 and 5, by either price distance or percentage price movement.
If Wave 5 is truncated, or contains an Impulse that is truncated, then neither Wave 3 nor Wave 4 can contain a subwave that is truncated. (A truncated pattern is where Wave 5 is shorter than Wave 4. This is also known as a failure.)
The maximum movement of Wave 5 is six times Wave 3 in both price and time.
Wave 5 has no minimum time constraint.
Impulse Guidelines:
Wave 1 can be a Leading Diagonal, but this is rare.
Wave 2 is usually a Zigzag based pattern.
Wave 2 usually takes a small amount of time compared to Wave 1. However, Wave 2 is usually takes more than 10% of the time taken by Wave 1.
Wave 2 generally retraces more than 30% of Wave 1 including internal data points.
Wave 2 will usually retraces less than 80% of Wave 1 .
The most likely retracement for Wave 2 is 50% or 61.8% of Wave 1.
The gross price movement of Wave 2 should be greater than the gross price movement of Waves 2 of 1, 4 of 1, 2 of 3 and 4 of 3.
If the gross movement of Wave 2 is between 33% and 40.3% retracement of Wave 1, it is most likely complete.
If the gross movement of Wave 2 has retraced to end of previous Wave 4 of 1, then it is most likely complete.
It is unlikely that Wave 3 will be shorter than Wave 1 by price.
The most likely price range for Wave 3 is between 1.5 and 3.5 times the price range of Wave 1.
Most likely range in time for Wave 3 is between 1 and 4 times the time taken by Wave 1.
Wave 4 is rarely a Zigzag based correction.
It is common for both Waves 4 & 2 to have approximately the same price movement.
Wave 4 will most often retrace more than 20% of Wave 3, including internal points.
Wave 4 will very often retrace about 38.2% of Wave 3.
Wave 4 does not often retrace Wave 3 by more than 50%.
Wave 4 will often retrace into the price territory of previous Wave 4 of Wave 1.
Wave 4 will most often retrace to the end of the previous Wave 4 of one lesser degree.
Waves 2 & 4 usually alternate between Zigzag and Flat. The other alternation is between a Triangle and a Flat.
Leveraged markets may at times overlap by up to 15% of Wave 2 by price.
The gross price movement of Wave 4 should be greater than the gross price movement of Waves 2 of 3, 4 of 3, 2 of 5 and 4 of 5.
Expect the time taken by Wave 4 to be between 100% - 270% of the time taken by Wave 2.
Wave 5 will usually move beyond the end of Wave 3.
When Wave 5 is extended (more than 161.8% longer than both Waves 1 and 3) a point within Wave 4 will often divide the entire Impulse Wave by 1.618.
If Wave 5 is extended (more than 161.8% longer than both Waves 1 and 3), it is common for its price length to be about 161.8% of the gross price length between the beginning of Wave 1 to end of Wave 3.
It is unusual for Wave 5 to travel a greater price or time percentage than Wave 3 traveled in its entirety.
The most likely price targets for Wave 5 are: 61.8% of Wave 1, 100% of Wave 1, 161.8% of Wave 1, 161.8% of the length from the beginning of Wave 1 to end of Wave 3.
If Wave 3 is about equal to 161.8% of Wave 1 by price, the most likely time for Wave 5 is about equal to the time taken by Wave 1.
One of the Impulse Waves (Waves 1, 3 or 5) generally extends (at least 162% times the next longest Impulse Wave).
The most likely Wave to extend is the 3rd Wave of an Impulse. However, in leveraged funds when the Impulse is rising and the degree is Primary or above, the most likely Wave to extend is Wave 5.
A non-extended 5th Wave of less than Primary degree usually has a lower peak volume than a third Wave. However, when the 5th Wave extends (less than Primary degree), Wave 5 has usually shows more volume.
Wave 5, when complete, usually has a lesser slope than Wave 3. However, in leveraged securities when the Impulse is rising and the degree is Primary or above, this is not usually the case.
Wave 5 is usually less than 4 times length of Wave 3 by time.
ZigZag Rules:
A ZigZag is a three wave structure labeled A-B-C, generally moving counter to the larger trend. It is the most common three wave Elliott pattern. Zigzags are corrective in nature.
Wave A must be an Impulse or a Leading Diagonal.
Wave B can only be a corrective pattern.
Wave B must be shorter than Wave A by price. All internal points are considered.
Wave B must be at least 20% of A by price.
Although there is no minimum time constraint for Wave B, it must not exceed 10 times the time taken by Wave A.
Wave C must be an Impulse or an Ending Diagonal.
If Wave A is a Leading Diagonal, then Wave C must not be an Ending Diagonal.
Wave C must be longer than 90% of Wave B by price.
Wave C must be less than 5 times Wave B by price.
It is not allowable to have both Wave 5 of A a failure (Wave 5 is shorter then Wave 4) and Wave 5 of C a failure.
Wave C must be no more than 10 times either Wave A or B in price or time.
ZigZag Guidelines:
It is unusual for a Wave within Wave A to have a greater gross price movement than Wave A.
Wave B should end nowhere near beginning of Wave A
Wave B should retrace at least 30% of Wave A.
Wave B is most likely to retrace Wave A by about 38.2%.
Wave B is next most likely to retrace Wave A by about 50%.
Wave B is next most likely to retrace Wave A by about 61.8%.
The largest Wave in B is usually less than the gross price movement of Wave A.
The time taken by Wave B is usually between 61.8% and 161.8% of the time taken by Wave A.
Wave C is most likely to have a similar price length to Wave A.
The next most likely price lengths for Wave C are 61.8% and 161% of Wave A
The next most likely price length for Wave C is 61.8% of Wave A beyond the end of Wave A.
If Wave C is much longer than 161.8% of A, then the pattern is more probably the beginning of an Impulse than a Zigzag.
If Wave C is complete, and has a greater slope than Wave A, expect the Zigzag to extend to an Impulse.
Although Wave C should always be greater in price to Wave B, in rare cases Wave C can be up to 10% shorter than Wave B.
The largest Wave within C by price is usually less than the gross price movement of Wave A.
The time taken by Wave C is usually between 61.8% of Wave A and 161.8% of the shortest Wave of A and B.
Flat Rules:
A Flat is a three wave pattern labeled A-B-C that moves generally sideways. It is corrective and counter-trend and is a very common Elliott pattern.
Wave A can be any corrective pattern except a Triangle.
Wave B can be any corrective pattern except a Triangle.
Wave B must retrace more than 70% of Wave A.
Wave B is less than twice the price movement of Wave A, including internal points of Wave B.
Although there is no minimum time constraint for Wave B, it must be less than 10 times Wave A.
Wave C must be an Impulse or Ending Diagonal.
Wave C must share some common price territory with Wave A.
Wave C must be less than twice the longest of Waves A and B, including internal points of Wave C.
Wave C must be less the three times the price distance of Wave A.
Disallow back to back failures.
Wave C must be no more than 10 times either Waves A or B in price and time.
There is no minimum time constrains for Wave A.
Flat Guidelines:
Wave A is usually a Zigzag family pattern.
Wave A is rarely an Expanding Triangle.
The largest Wave within Wave A is usually less than Wave A by price.
Wave B is usually a Zigzag family pattern.
Wave B is rarely a Flat.
Wave B is usually greater than 95% of Wave A by price.
Wave B is usually less than 140% of Wave A by price.
The largest Wave within B is usually less than Wave A by price.
The time taken by Wave B is generally between 61.8% and 161.8% of Wave A.
Wave C is rarely an Ending Diagonal.
Wave C is often about the same length as both Wave A and B.
Wave C often ends at point which is a percent of Wave A beyond end of Wave A equal to the same percentage away from the start of Wave A.
Wave C usually retraces a minimum of 100% of Wave B.
Wave C normally reaches to the end of Wave A
Wave C is not often more than 140% of the longer of Wave A or B.
If Wave C is longer than Wave B, then Wave C is often about 61.8% of A beyond end of A.
If Wave C is longer than Wave B, then Wave C is often about 161.8% of Wave A from end of Wave B by price.
The time taken by Wave C is generally between 61.8% of Wave 1 to 161.8% of the shortest of Waves A and B.
Diagonal Rules:
LD = Leading Diagonal, ED = Ending Diagonal
A Diagonal is a common 5 Wave Impulsive pattern labeled 1-2-3-4-5 that moves with the larger trend. Diagonals move within two channel lines drawn from Waves 1 to 3, and from Waves 2 to 4. A Diagonal must be contracting. There exist two types of Diagonals; Leading and Ending. They have a different internal structure and are seen in different positions within the larger degree pattern. Ending Diagonals are much more common than Leading Diagonals.
Wave 1 of a LD must be an Impulse or a LD.
Wave 1 of an ED must be a Zigzag family pattern.
Wave 2 may be any corrective pattern except a Triangle.
Wave 2 must be less than Wave 1 by price.
Wave 3 of a LD must be an Impulse.
Wave 3 of an ED must be a Zigzag family pattern.
Wave 3 must be greater than Wave 2 by price.
Wave 4 may be any corrective pattern.
Waves 2 and 4 must either overlap or be within 10% of length Wave 3 of doing so. All internal data points are considered.
The time taken by Wave 4 must be between 10% and 10 times the time taken by Wave 2.
Wave 5 of an ED must be a Zigzag family pattern.
Wave 5 of a LD must be an Impulse or ED.
If Wave 1 is a LD then Wave 5 cannot be an ED.
Wave 3 must not be shorter than both Waves 1 and 5.
Wave 5 must be at least 80% of Wave 4 by price.
Wave 5 is never the longest when compared with Wave 1 and Wave 3.
Wave 5 is always less than Wave 3 by price.
The intersection of the channel lines must be beyond the end of the pattern.
Diagonals must move within the two channel lines or be within 10% of gross movement.
Channel lines must converge, slope in the same direction and neither be horizontal.
The maximum number of pattern lengths into the future that the channel lines intersect is 4.
The minimum time for Wave 5 is 10% of Wave 4. The maximum time for Wave 5 is 5 times Wave 3.
Diagonal Guidelines:
Wave 1 of a LD is usually an Impulse, but in rare cases may be a LD.
Wave 2 is usually ZigZag family pattern.
Generally Wave 2 is greater than 35% of Wave 1's gross price movement.
Wave 4 is commonly a Zigzag.
It is rare that at least either Waves 2 or 4 of an ED is not a Zigzag family pattern.
Generally Wave 4 is greater than 35% of Wave 3's gross price movement.
The end points of Waves 1 and 4 generally overlap.
Expect the time taken by Wave 4 to be between 20% and 5 times Wave 2.
Wave 5 is usually greater than Wave 4 by price.
It is typical for Wave 5 of a LD to end before reaching the channel line.
It is typical for Wave 5 of an ED to exceed the channel line.
Triangle Rules:
CT = Contracting Triangle, ET = Expanding Triangle
A Triangle is a common 5 Wave pattern labeled A-B-C-D-E that moves counter-trend and is corrective in nature. Triangles move within two channel lines drawn from Waves A to C, and from Waves B to D. A Triangle is either Contracting or Expanding depending on whether the channel lines are converging or expanding. Expanding Triangles are rare.
Wave A of a CT is always either a Zigzag based pattern or a Flat. Wave A of an ET can only be a Zigzag based pattern.
Within Wave A of a CT, Wave B must be less than 105% of Wave A's price length. The same rule applies for Waves C and D of the CT.
Wave B must be a Zigzag based pattern.
Wave C of a CT can be any corrective pattern except a Triangle. Wave C of an ET must be a Zigzag based pattern.
Wave B of a CT must retrace Wave A by 50%.
For a CT, Wave C must be less than Wave B by price and Wave C must be greater than or equal to 50% of Wave B by price.
For an ET, Wave B must be less than Wave C by price and Wave B must be greater or equal to 50% of Wave C by price.
Wave D of a CT can be any corrective pattern except a Triangle. Wave D of an ET must be a Zigzag based pattern.
Wave B, C and D must not move more than 10% beyond the A-C & B-D channel lines (based on the length of Wave C).
In an ET, Wave C must be less than Wave D by price and Wave C must be more than 50% of Wave D by price.
In an ET, Wave A must move within the A-C channel or pass through it by no more than 10% of the length of Wave B by price.
In an CT, Wave D must be less than Wave C by price and Wave D must be greater than or equal to 50% of Wave C by price.
The intersection of the channel lines must occur beyond the end of a CT, and before the beginning of an ET.
The channel lines must either converge or diverge. They cannot be parallel.
Wave D of a CT must not end such that when retraced 25% by E, E will not reach the price territory of A.
Only one channel line in a CT may be horizontal. Neither channel line of an ET can be horizontal.
The maximum time for Wave D is 4 times Wave C.
Wave E of a CT can either be a CT or a Zigzag family pattern. For an ET, Wave E must be a Zigzag based pattern.
In an ET, Wave E must be greater than Wave D by price and Wave D must be greater or equal to 50% of Wave E by price.
In an ET, either Wave A or B will be the shortest Wave in the pattern.
In a CT, Wave E will be less than Wave D by price and Wave E will be greater than or equal to 25% of Wave D by price.
In a CT, either Wave A or B will be the longest Wave in the pattern.
In a CT, the maximum time for Wave E is 4 times Wave C.
Wave E must end in the price territory of A.
Wave E must not pass through the B-D line, or if it does, by no more than 10% of the length of Wave D.
The maximum number of pattern lengths into the future that the channel lines intersect is 6.
Triangle Guidelines:
Wave A is usually a zigzag family pattern.
Wave B is usually a zigzag family pattern.
Wave C is often a zigzag family pattern.
Wave C usually takes more time than any other Wave in the pattern.
Wave D is usually a zigzag family pattern.
Waves B, C and D rarely move outside the B-D line.
Waves A, B, C and E rarely move outside the A-C line.
Wave E is usually a zigzag family pattern or the same type of Triangle as the larger pattern.
Usually at least two Waves travelling in the same direction will relate by about 61.8%.
It is common for two or more adjacent Waves will be related by 61.8%.
In a CT, Wave E normally retraces Wave D by about 70%.
Double and Triple ZigZag Rules:
Double (DZ) and Triple (TZ) Zigzags are similar to Zigzags, and are typically two or three Zigzag patterns strung together with a joining Wave called an x Wave, and are corrective in nature. Doubles are not common, and Triples are rare. Zigzags, Double Zigzags and Triple Zigzags are also known as Zigzag family patterns, or 'Sharp' patterns. Double Zigzags are labeled w-x-y, while Triple Zigzags are labeled w-x-y-xx-z. Both these patterns are included in the list of rules and guidelines below. Only a Double Zigzag is illustrated below.
Wave W must be a Zigzag.
Wave C of W cannot be a failure.
Wave X can be any corrective pattern except an ET.
Wave X must be smaller than Wave W by price.
Wave X must retrace at least 20% of W by price.
The gross price movement of Wave X must be less then 3 times the price movement of Wave W.
Wave X must be no more than 5 times Wave W by time.
Wave Y must be a Zigzag
Wave Y must be greater than or equal to Wave X by price.
Back to back and double failures are not allowed.
Wave Y must be greater than 90% of Wave W by price, and Wave Y must be less than 5 times Wave W by price.
Wave Y must be no more than a factor of 5 times either Wave X or W in price or time.
Wave C of Y cannot be a failure.
Wave XX can be any corrective pattern except an ET.
Wave XX must be smaller than Wave Y by price.
Wave XX must retrace at least 20% of Y.
The gross price movement of Wave XX must be less than 3 times the gross movement of Wave W.
Wave Z must be a Zigzag
Wave Z must be greater than or equal to Wave XX by price.
Wave Z must be less than 5 times Wave Y by price, and must also be less than 5 times Wave W by price.
Wave Z must be no more than a 5 times either Waves XX, Y, X or W in both price and time.
Double and Triple ZigZag Guidelines:
The largest Wave in Wave W is usually less than Wave W by price.
Wave X is usually a Zigzag family pattern.
Wave X is usually less than 70% of Wave W by price.
Wave X will usually retrace at least 30% of Wave W.
Wave X is most likely to be a 38.2% retracement of Wave W.
Wave X is next most likely to be a 50% retracement of Wave W.
Wave X is next most likely to be a 61.8% retracement of Wave W.
The largest Wave in Wave X is usually less than 140% of Wave W by price.
The time taken by Wave X is usually between 61.8% and 161.8% of Wave 1.
Wave Y is next most likely to be equal to 61.8% or 161.8% of W by price.
Expect the time taken by Wave Y to be between 61.8% of Wave W and 161.8% of shortest of Wave W and X.
Wave XX is usually a Zigzag family pattern.
Wave XX is usually less than 70% of Wave Y by price.
Wave XX will usually retrace at least 30% of Wave Y.
Wave XX is most likely to be a 38.2% retracement of Wave Y.
Wave XX is next most likely to be a 50% retracement of Wave Y.
Wave XX is next most likely to be a 61.8% retracement of Wave Y.
The largest Wave within Wave XX is usually less than 140% of Wave Y by price.
Wave Z is most likely to be about equal to Wave Y by price.
Wave Z is next most likely to be about equal to 61.8% or 161.8% of Wave Y.
The largest Wave in Wave Z is usually less than Wave Y by price.
Double and Triple Sideways Rules:
Double (D3) and Triple (T3) Sideways patterns are similar to Flats, and are typically two or three corrective patterns strung together with a joining Wave, called an x Wave, and are all corrective in nature. Doubles are not common, and Triples are rare. Doubles are labeled w-x-y, while Triples are labeled w-x-y-xx-z. Both these patterns are included in the list of rules and guidelines below. Only a Double 3 is illustrated below.
Wave W may be any corrective pattern except a Triangle, double or triple.
Wave C of W cannot be a failure.
Wave X may be any corrective pattern except a Triangle, double or triple.
The minimum X Wave retracement is 70% of Wave W.
The maximum price distance of Wave X is 150% of both the previous Wave and ensuing Wave. All internal data points are considered.
Although there is no minimum time for Wave X, the maximum time is 10 times the time taken by Wave W.
Wave Y may be any corrective pattern except double, triple or a Triangle in a Triple Zigzag. However, Wave Y cannot be a Zigzag if Wave W is a Zigzag.
Wave Y must be greater than or equal to Wave X by price, except if Wave Y is a Triangle.
Wave C of Y cannot be a failure.
Wave Y must be no more than 5 times either Wave X or W in price and time.
Wave Y has no minimum time constraint.
Wave XX may be any corrective pattern except a Triangle, double or triple.
The minimum Wave XX retracement is 70% of Wave Y.
The maximum Wave XX retracement is 150% of previous Wave and ensuing Wave. All internal data points are considered.
Wave Z may be any corrective pattern except double or triple. However Wave Z cannot be a Zigzag if Y is a Zigzag.
Wave Z is greater than or equal to XX by price.
Wave Z must be no more than 5 times either Waves XX, Y, X or W in price and time.
Back to back and double failures are not allowed.
If Wave Y is greater than Wave W by price, then the maximum Wave Z price movement is twice the price movement of Wave W.
Double and Triple Sideways Guidelines:
The largest Wave in Wave W is usually less than 140% of Wave W by price.
Wave X is usually a Zigzag family pattern.
The largest Wave in Wave X is usually less than Wave W by price.
Wave X is usually less than 140% of W by price.
Wave X is usually greater than 95% of Wave W by price.
The most likely retracement for Wave X is 110% of Wave W.
Time for X is generally between 62% of W1 and 1.618 of the time of W1.
If Wave Y is a Triangle, the most likely length of Wave Y is about 61.8% of Wave W. If Wave Y is not a Triangle, the most likely lengths for Wave Y are 100% of Wave W, 161.8% of Wave W and 10% of the length of Wave W beyond the end of Wave W.
The largest Wave in Wave Y is usually less than 140% of Wave W by price.
Wave Y is usually less than twice the longest of Wave W and Wave X in price.
Wave Y is generally between 61.8% of Wave W and 161.8% of Wave W in time.
Wave XX is usually a Zigzag family pattern.
The largest Wave in Wave XX is usually less than Wave Y in price.
Wave XX is usually less than 140% of Wave Y by price.
Wave XX is usually greater than 95% of Y by price.
The most likely retracement for Wave XX is 110% of Wave Y.
If Wave Y is a Triangle, most likely length by price is 61.8% of Wave W. If Wave Y is not a Triangle, then the most likely lengths are 100% of Wave W, 161.8% of Wave W and 10% of length of Wave W beyond the end of Wave W, all by price.
The largest wave in Wave Z is usually less than 140% of Wave Y by price.
Wave Z is usually less than twice the longest of Wave Y and Wave XX.
| Description: |
| CLICK ON PICTURE TO SEE ENLARGED PICTURES IN NEW WINDOW |
|
| Filesize: |
149.16 KB |
| Viewed: |
785 Time(s) |
|
Last edited by mayurnsk on Mon Jun 23, 2008 4:03 pm; edited 5 times in total |
|
| Back to top |
|
 |
|
| |
gautammohapatra
White Belt

Joined: 04 Mar 2008
Posts: 21
|
| Post: #2 Posted: Sat May 10, 2008 12:35 am Post subject: Elliot wave analysis |
|
|
Mayur. This very handy and concise. Also kindly share your ideas on nifty present situation with charts showing your interpretation of elliot waves.
Thanks - this was great
Gautam
|
|
| Back to top |
|
|
mayurnsk
Moderator
Joined: 18 Jan 2007
Posts: 216
Location: Nasik, Maharashtra
|
| Post: #3 Posted: Sat May 10, 2008 12:38 am Post subject: |
|
|
Hi
gautammohapatra sir
Swaroop is good elliotian I have asked him to keep updating this thread. I have just taken the initiative he will keep updating here , watch this space.
Mayuresh Jahagirdar
Nasik
Maharashtra
|
|
| Back to top |
|
|
mayurnsk
Moderator
Joined: 18 Jan 2007
Posts: 216
Location: Nasik, Maharashtra
|
| Post: #4 Posted: Sat May 10, 2008 12:25 pm Post subject: |
|
|
Hi
All elliottians on icharts or from other forum. Do write about your views about markets in elliot terms. You are most welcome to have your views on market here in forum and in this thread.. any body can contribute.
Mayuresh Jahagirdar
Nasik
Maharashtra
|
|
| Back to top |
|
|
Onyx
White Belt
Joined: 12 Mar 2008
Posts: 1
|
| Post: #5 Posted: Sat May 10, 2008 3:35 pm Post subject: Simplify further |
|
|
Hi Mayur,
The work you have done is commendable. Why dont you simplify it further ? Like, you can segment the writeup in various Waves. It will be easy to read and comprehend.
Once again i congratulate you for the initiative you have taken.
Keep it up !
Onyx
PS: I will try and post my contribution very soon.
|
|
| Back to top |
|
|
mayurnsk
Moderator
Joined: 18 Jan 2007
Posts: 216
Location: Nasik, Maharashtra
|
| Post: #6 Posted: Sat May 10, 2008 4:25 pm Post subject: |
|
|
Hi
Onxy
Yeah man I am looking forward to see your contribution under this thread...lets take this thread forward.
Mayuresh Jahagirdar
Nasik
Maharashtra
|
|
| Back to top |
|
|
mayurnsk
Moderator
Joined: 18 Jan 2007
Posts: 216
Location: Nasik, Maharashtra
|
|
| Back to top |
|
|
gd_godbole
White Belt
Joined: 08 May 2008
Posts: 3
|
| Post: #8 Posted: Sat May 10, 2008 10:45 pm Post subject: EWT made simpler - wow |
|
|
Hi mayur,
Keep it up man, u made it simpler.

GG
|
|
| Back to top |
|
|
mayurnsk
Moderator
Joined: 18 Jan 2007
Posts: 216
Location: Nasik, Maharashtra
|
| Post: #9 Posted: Sun May 11, 2008 12:52 am Post subject: |
|
|
Hi GG
Thanx sir....... for encouragement...that is what needed
Keep watching the space....
Mayuresh Jahagirdar
Nasik
Maharashtra
|
|
| Back to top |
|
|
anupsb
White Belt
Joined: 04 May 2007
Posts: 21
|
| Post: #10 Posted: Mon May 12, 2008 11:23 am Post subject: |
|
|
Hi Mayur,
Thanks for ur simple but detailed rules for elliot waves. This helps a lot as i am trying to learn elliot waves. Great work. Keep it up.
Regards,
Anup Bade
|
|
| Back to top |
|
|
swaroopbn
White Belt
Joined: 12 Feb 2008
Posts: 39
|
| Post: #11 Posted: Tue May 13, 2008 12:57 am Post subject: |
|
|
Mayur - let me first congratulate you to knit all elliot rules together and posting here for everyone's benefit. Kudooos to you .
I am posting the elliot analysis of current Nifty wave. Nifty made a major top at 6357 and fell till 4449-4469 levels in A-B-C pattern. It's still a point of contention whether A-B-C is complete or Wave A happened in a-b-c pattern.
See attched Pic for A-B-C reference

Anyways considering both view - we are undergoing a mojor wave now (either corrective B or impulse wave) - won't discuss more as time is not ripe to take a call. Current wave is happening in a 1-2-3-4-5 fashion. Well some have views that it's happening in a-b-c pattern and peaked at 5299  . However I wud still stick to my views . However I wud still stick to my views
Wave 1: 4469-4968
Wave 2: 4968-4629
Wave 3: in progress 
Wave 4 & 5: Picture abhi baki hai
Please see the Pic below for Wave 1 and Wave 2 minute details

Minute Wave 1 happened in i-ii-iii-iv-v fashion and Wave 2 happened in a-b-c fashion
Now the most debated one 
See below the Picture for Wave 3 minute details
Now i leave it to u guys to decide n trade.
BABA still says Picture abhi baki hai 
Swaroop
Hyderabad
|
|
| Back to top |
|
|
mayurnsk
Moderator
Joined: 18 Jan 2007
Posts: 216
Location: Nasik, Maharashtra
|
| Post: #12 Posted: Tue May 13, 2008 1:05 am Post subject: |
|
|
Hi
Swaroop
GOOD work dude. Keep it up nice post really nice post. You were unnecessarily wasting time earlier
and yes I agree picture/movie abhi baki hai ...RNE BABA will discuss with Gann baba before directing further
I just want to see querries being posted here for your post , I would love to see that. Let them come.
Regards
Mayuresh P. Jahagirdar
Nasik
Maharashtra
|
|
| Back to top |
|
|
swaroopbn
White Belt
Joined: 12 Feb 2008
Posts: 39
|
| Post: #13 Posted: Sun May 18, 2008 11:03 am Post subject: EW is rocking |
|
|
Hi iChartians,
I am back!
When mkt was grinding down - EW confirmed the downside to be max 4910-4930. Oops against all the odds the downtrending mkt got a major support at the lower trendline and started it's north bound journey again.
In my previous post I mentioned we are not in Wave C - we will see more upside (for time being more than 5299  ). This was confirmed last week when mkt crossed 5K and challenged 200 DMA again. Now we are in sub/minute wave 5 of Major Wave 3. Pls find below the attched pic - anyways this is same as the previous post - i just took a latest snapshot ). This was confirmed last week when mkt crossed 5K and challenged 200 DMA again. Now we are in sub/minute wave 5 of Major Wave 3. Pls find below the attched pic - anyways this is same as the previous post - i just took a latest snapshot
Ok now let's look at the current wave in more detail - the base for current wave is 5-i (Start Pt - 4914.8 and End Pt - 5065.3). On a close look wave 5-i is also completed in 1-2-3-4-5 fashion . Refer the pic below
Now, the final verdict. Let's see how much current wave can extend! The tgts and supports for current wave is mentioned below
Tgts: 5158/5215/5308
Supports: 5010/5060/5080
Looks like tgt 5158 is already achieved on friday (05/16) during my journey to Vaishno Devi.
Jai Mata Di.
Regards,
Swaroop
Hyderabad
Disclaimer: This is my personal interpretation on Nifty Chart based on my understanding on EW  . .
|
|
| Back to top |
|
|
mayurnsk
Moderator
Joined: 18 Jan 2007
Posts: 216
Location: Nasik, Maharashtra
|
| Post: #14 Posted: Sun May 18, 2008 11:32 am Post subject: |
|
|
Hi swarrop
JAI MATA DI.....................JAI MATA DI......................JAI MATA DI
Wellcome Back !!!!!
Nice post keep it up, I agree with your post. Now limited Upside, Get ready for good short Jai mata di
Regards
Mayuresh Jahagirdar
Nasik
Maharashtra
|
|
| Back to top |
|
|
kiran.jain
White Belt
Joined: 31 Jan 2008
Posts: 47
Location: mumbai
|
| Post: #15 Posted: Mon May 19, 2008 11:18 am Post subject: |
|
|
hello mayur..... first thnks r making this forum....would help a lot 4 new conner like me......
hey swaroop.......man..... wow...... one hats 2 u 4 ur pics......it make picture more clear.....
getting little little.....as m slow in reading.... but ur pic made me undertsnad little more.....
looking 4ward 2 see some more pics....and understand...
thnks u all
regards
jain kiran
|
|
| Back to top |
|
|
|
|
You cannot post new topics in this forum
You cannot reply to topics in this forum
You cannot edit your posts in this forum
You cannot delete your posts in this forum
You cannot vote in polls in this forum
You can attach files in this forum
You can download files in this forum
|
Powered by phpBB © 2001, 2005 phpBB Group
|
|
|


