| View previous topic :: View next topic |
| Author |
EoD Charts Analysis |
nlokwani
White Belt

Joined: 30 Aug 2009
Posts: 11
|
Post: #1  Posted: Thu May 20, 2010 7:13 pm Post subject: EoD Charts Analysis Posted: Thu May 20, 2010 7:13 pm Post subject: EoD Charts Analysis |
 |
|
Hi,
I am starting a thread to analyze and discuss EoD charts - daily, weekly and monthly time frame to get a feel of overall trend.
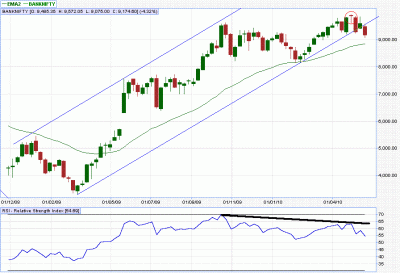
Bank nifty is my fav scrip and it has had a great run from a bottom of 3297 to a top(?) of 9940. Attaching a weekly chart which shows:
1. Long term Trend line broken comprehensively
2. 34 ema still holding.
3. RSI on a decline
Once 34 ema is broken, BNF enters a confirmed down trend.
Regards
Naren
| Description: |
|
| Filesize: |
24.04 KB |
| Viewed: |
708 Time(s) |
|
|
|
| Back to top |
|
 |
|
|
 |
nlokwani
White Belt

Joined: 30 Aug 2009
Posts: 11
|
Post: #2  Posted: Fri May 21, 2010 4:00 pm Post subject: Banknifty 21 May Posted: Fri May 21, 2010 4:00 pm Post subject: Banknifty 21 May |
 |
|
Hi,
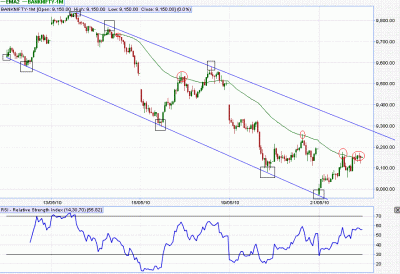
I am attaching 15 min trend channel of Banknifty with RSI and 55 Ema. The things to note are:
1. Lower trendline of this channel gave excellent support to BNF at the open and propelled the price upwards. Past support areas are marked by rectangles at the lower trendline.
2. BNF upward journey met with 55 ema and gave a excellent trade-able rejection, marked in red circle. BNF again took support after a while and second rejection was not very clear and prices kept on oscillating around 55 ema.
We are still in the down trend channel. Most possible options from here are:
1. Rejection from 89 ema or upper trend line on Monday
or
2. Prices break the upper trend line and possibly end this down trend.
Regards
Naren
| Description: |
|
| Filesize: |
27.58 KB |
| Viewed: |
658 Time(s) |
|
|
|
| Back to top |
|
 |
nlokwani
White Belt

Joined: 30 Aug 2009
Posts: 11
|
Post: #3  Posted: Sun May 23, 2010 7:12 pm Post subject: 200 DMA Posted: Sun May 23, 2010 7:12 pm Post subject: 200 DMA |
 |
|
Hi,
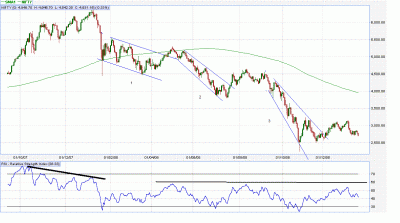
Nifty and many other scrips breaking and staying below 200 DMA is a significant event. It may mark the end of year long bull run and hint towards a consolidation.
Last time 200 Dma was challenged and broken was in Feb-Mar 2008. Once Nifty went below 200 Dma, following were the events:
1. Nifty briefly challenged 200 dma in Feb for a period of two weeks and again went below it. Stayed within a Down trend channel for a period of three months
2. Again challenged in May after a quick rally and second down trend channel also lasted for three months
3. Rallied in Jul-Aug and multiple rejections from 89 ema this time. Again a three month down trend channel.
Consolidation thereafter. Interesting to note is that RSI was in sharp decline during the first phase and slow and steady decline thereafter.
Thus 200 DMA seems a important and intresting phenomena to observe and note the overall trend.
Regards,
Naren
| Description: |
|
| Filesize: |
31.46 KB |
| Viewed: |
595 Time(s) |
|
|
|
| Back to top |
|
 |
nlokwani
White Belt

Joined: 30 Aug 2009
Posts: 11
|
Post: #4  Posted: Mon May 24, 2010 4:37 pm Post subject: Posted: Mon May 24, 2010 4:37 pm Post subject: |
 |
|
Hi,
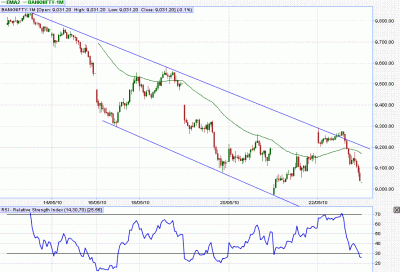
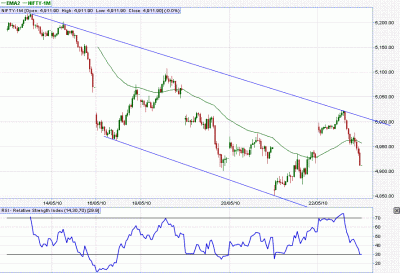
Attaching 2 snapshots to summarize today's charts - Nifty and Banknifty.
Nifty - 15 mins
1. Nifty opened close to 200 DMA on daily and for a brief period managed to crawl above it.
2. Faced stiff resistance at 5224 from price channel of past 8 days. Rejection from upper trend line and simultaneous rejection from 200 DMA on EoD chart caused prices to melt in afternoon session.
NF Headed towards the lower trend line.
Banknifty - 15 mins:
1. Opened with rejection from price channel - upper trend line
2. Found good support at 9200 and subsequent rejection from upper trend line. Closed within the channel and BNF headed towards the lower trend line.
Thus a failed attempt to resurrect upmove today.
Regards
Naren
| Description: |
|
| Filesize: |
27.15 KB |
| Viewed: |
583 Time(s) |
|
| Description: |
|
| Filesize: |
27.59 KB |
| Viewed: |
547 Time(s) |
|
|
|
| Back to top |
|
 |
nlokwani
White Belt

Joined: 30 Aug 2009
Posts: 11
|
Post: #5  Posted: Sat May 29, 2010 8:31 pm Post subject: Nifty Daily Posted: Sat May 29, 2010 8:31 pm Post subject: Nifty Daily |
 |
|
Hi,
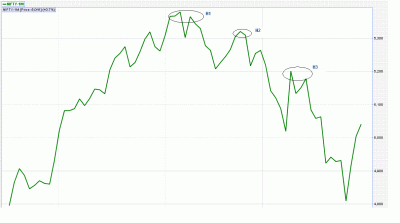
A downtrend is defined as succession of lower High's. And a trend is supposed to be valid till unless the last pivot is broken.
Attaching a daily chart of Nifty which had successive pivots at 5377, 5322, and 5202.
Since last pivot is yet to be broken, we can assume that Nifty is still in down trend for now.
Regards
Naren
| Description: |
|
| Filesize: |
19.97 KB |
| Viewed: |
566 Time(s) |
|
|
|
| Back to top |
|
 |
mbn
White Belt

Joined: 29 Nov 2007
Posts: 27
|
Post: #6  Posted: Sun May 30, 2010 8:43 pm Post subject: Posted: Sun May 30, 2010 8:43 pm Post subject: |
 |
|
| dow theory of HH and HL and LH and LL is universally accepted theory. but im confused abt ur pivots based on "line" chart instead of OHLC/candle charts. atleast i hope u r clear.
|
|
| Back to top |
|
 |
nlokwani
White Belt

Joined: 30 Aug 2009
Posts: 11
|
|
| Back to top |
|
 |
mithu2
White Belt

Joined: 17 Nov 2009
Posts: 10
|
Post: #8  Posted: Wed Jun 09, 2010 9:54 pm Post subject: about spot nifty Posted: Wed Jun 09, 2010 9:54 pm Post subject: about spot nifty |
 |
|
| the long term trend of spot nifty still intact. only problem is under 200 dma
|
|
| Back to top |
|
 |
nlokwani
White Belt

Joined: 30 Aug 2009
Posts: 11
|
Post: #9  Posted: Tue Aug 10, 2010 5:01 pm Post subject: Posted: Tue Aug 10, 2010 5:01 pm Post subject: |
 |
|
What correction are we talking about?
Nifty spot can touch the channel lower TL, and resume its journey!
| Description: |
|
| Filesize: |
26.8 KB |
| Viewed: |
556 Time(s) |

|
|
|
| Back to top |
|
 |
|

