| View previous topic :: View next topic |
| Author |
EoD DMI/ADX |
ConMan
White Belt

Joined: 06 Aug 2008
Posts: 344
|
|
| Back to top |
|
 |
|
|
|
ridinghood
Yellow Belt

Joined: 16 Apr 2009
Posts: 724
|
Post: #2  Posted: Sat Jul 24, 2010 5:18 pm Post subject: Posted: Sat Jul 24, 2010 5:18 pm Post subject: |
 |
|
hi qgm
pl let me know what is adx ? is it advance decline ratio?
nd i cant see adx on the chart posted by u! only dmi nd rsi apart from nifty price. pl help.
vry unique observation though!
regs
ridinghood
|
|
| Back to top |
|
|
ConMan
White Belt
Joined: 06 Aug 2008
Posts: 344
|
| Post: #3 Posted: Sat Jul 24, 2010 11:56 pm Post subject: |
|
|
Dear Ridinghood
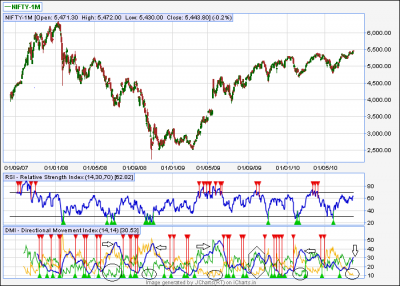
ADX combines +DI with -DI, and then smooths the data with a moving average to provide a measurement of trend strength. Because it uses both +DI and -DI, ADX does not offer any indication of trend direction, just strength.
The blue line in DMI indicator is ADX
Regards
|
|
| Back to top |
|
|
jjm
White Belt
Joined: 17 Mar 2010
Posts: 411
|
| Post: #4 Posted: Sun Jul 25, 2010 4:32 pm Post subject: ADX |
|
|
Dear Ridinghood & All
The ADX is an Oscillator, which measures the strength in the ongoing trend. ADX does not tell the trend as bullish or bearish, but is used to determine whether or not market is trending or trading regardless of its up or down. It indicates a strong trend over 40 and weak trend below 20. The+DI( POSITIVE DIRECTIONAL MOVEMENT) AND - DI(NEGATIVE DIRECTIONAL MOVEMENT) are the lines determining whether the trend is up or down.
1. in strong trend( ADX>40) one should use trend following indicators such as MA and MACD.
2. In weak trend(ADX<20) one should follow momentum indicators such as RSI and Stochastic.
3.When+DI cuts -DI from upside down, It's a bear trend and should prefer only short.
4. When-DI cuts + DI from upside down its a bull trend and should prefer only short.
would you like to have more information..send me a mail.. will provide material on same..
Am alway there in SB just buzz in with your email add..will send you stuff i have on this
Regards,
JJM
|
|
| Back to top |
|
|
ridinghood
Yellow Belt
Joined: 16 Apr 2009
Posts: 724
|
| Post: #5 Posted: Sun Jul 25, 2010 6:29 pm Post subject: |
|
|
hi qgm nd jjm
thnx to both of u for ur kind responses!
regs ridinghood
|
|
| Back to top |
|
|
ridinghood
Yellow Belt
Joined: 16 Apr 2009
Posts: 724
|
| Post: #6 Posted: Sun Jul 25, 2010 6:40 pm Post subject: |
|
|
hi qgm nd jjm
thnx to both of u for ur kind responses!
regs ridinghood
|
|
| Back to top |
|
|
amitkbaid1008
Yellow Belt
Joined: 04 Mar 2009
Posts: 540
|
| Post: #7 Posted: Sun Jul 25, 2010 10:39 pm Post subject: |
|
|
| Dear QGM I think you are not explained the chart very clearly. Please mark the example clear for clearing your point about ADX<10. Also the chart is very condensed so not easy to view it correctly.
|
|
| Back to top |
|
|
ConMan
White Belt
Joined: 06 Aug 2008
Posts: 344
|
| Post: #8 Posted: Mon Jul 26, 2010 9:43 am Post subject: |
|
|
I know the chart is very condensed ... Its a 3 year chart & will be like this only. You can copy the same and paste it on MS paint then zoom to see the areas marked.
Thanks
|
|
| Back to top |
|
|
ridinghood
Yellow Belt
Joined: 16 Apr 2009
Posts: 724
|
| Post: #9 Posted: Mon Jul 26, 2010 3:30 pm Post subject: |
|
|
thnx qgm. will do the same!
regs
ridinghood
|
|
| Back to top |
|
|
sherbaaz
Yellow Belt
Joined: 27 May 2009
Posts: 543
|
| Post: #10 Posted: Tue Jul 27, 2010 9:43 am Post subject: |
|
|
Hi QGM,
Nice thread. One of the very good indicator. It would be nice if you can continue this thread and also put more information about ADX.
Regards,
|
|
| Back to top |
|
|
sunrays
White Belt
Joined: 19 Dec 2009
Posts: 71
|
| Post: #11 Posted: Tue Jul 27, 2010 9:51 pm Post subject: reliance |
|
|
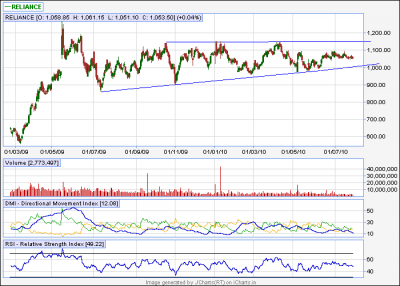
triangle pattern in reliance.....
dmi+ dmi- seems to be consolidating in my terms for long .......the blue line also known as adx seems to be consistently trading blw 25 indicating the stock hasn't had a decent lasting momentum based move up/down for long.......can ril deliver this year either up or down
| Description: |
|
| Filesize: |
16.11 KB |
| Viewed: |
666 Time(s) |
|
|
|
| Back to top |
|
|
psri
White Belt
Joined: 01 Jul 2009
Posts: 18
|
| Post: #12 Posted: Wed Jul 28, 2010 10:21 am Post subject: ADX/DMI |
|
|
hi jjm,
I think there is atypo error in the post.
in the explanationgiven by u on +D! and -D!, both the scenarios are given as short. One shd be Long... Is it not?
GS
|
|
| Back to top |
|
|
jjm
White Belt
Joined: 17 Mar 2010
Posts: 411
|
| Post: #13 Posted: Wed Jul 28, 2010 10:26 am Post subject: Typo error |
|
|
Dear Psri,,

U r right buddy
Regards,
JJM
|
|
| Back to top |
|
|
ConMan
White Belt
Joined: 06 Aug 2008
Posts: 344
|
| Post: #14 Posted: Thu Jul 29, 2010 2:33 pm Post subject: |
|
|
Sure Sherbaaz
Ill try and post a few....request others to join me in this forum
Regards
|
|
| Back to top |
|
|
jjm
White Belt
Joined: 17 Mar 2010
Posts: 411
|
| Post: #15 Posted: Sun Aug 01, 2010 4:35 pm Post subject: ADxellence |
|
|
Dear All,
While doing google...Got a name of book on ADX.
AdXcellence-power trend strategies by Dr. Charles Schaap.. though not read ... you may get relevant information...
Regards,
JJM
|
|
| Back to top |
|
|
|