| View previous topic :: View next topic |
| Author |
For Chirag-20/35/55 sma study for nifty |
vkmkc
White Belt

Joined: 14 Jun 2011
Posts: 59
|
Post: #46  Posted: Mon Jun 20, 2011 11:10 pm Post subject: Posted: Mon Jun 20, 2011 11:10 pm Post subject: |
 |
|
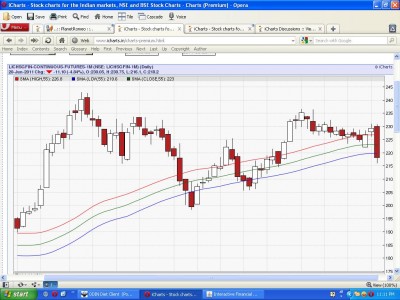
| Rahulsharmaat wrote: | | LIC Future 55 SMA close is 223-- so if it dosent go above this tommorow-- then Short can be taken with 55 SMA high as SL |
Rahul can you tell us how did u find that?
|
|
| Back to top |
|
 |
|
|
|
vkmkc
White Belt
Joined: 14 Jun 2011
Posts: 59
|
| Post: #47 Posted: Mon Jun 20, 2011 11:12 pm Post subject: Re: o k |
|
|
| chiragbvyas wrote: | Mr. ronypan
I do not have any charting software, plus never attended any technical seminars, even avoided free seminars too. we are using this system since last four years and developed in microsoft excel 2003. when i come to know about icharts.in i use charts (premium) and jcharts (eod). i have never drawn a trendline also not use pivot or any other indicators given here.
so i do not have any idea who teaches what and what not. i just use this 55 days sma high low and close, and i can proudly admit that it has been proved profitable always when used with proper and maintained stop loss. |
Chirag, please guide me regarding the JCharts [EOD] with respect to SMA55
|
|
| Back to top |
|
|
Rahulsharmaat
Black Belt

Joined: 04 Nov 2009
Posts: 2766
|
| Post: #48 Posted: Mon Jun 20, 2011 11:13 pm Post subject: |
|
|
i am very new-- i just tried to post what i understood--with what chirag bhai said
| Description: |
|
| Filesize: |
128.52 KB |
| Viewed: |
561 Time(s) |
|
|
|
| Back to top |
|
|
vkmkc
White Belt
Joined: 14 Jun 2011
Posts: 59
|
| Post: #49 Posted: Mon Jun 20, 2011 11:16 pm Post subject: |
|
|
| Rahulsharmaat wrote: | | i am very new-- i just tried to post what i understood--with what chirag bhai said |
Absolutely BULLS EYE, u had hit on the nail but how did u find the stock?
|
|
| Back to top |
|
|
Rahulsharmaat
Black Belt
Joined: 04 Nov 2009
Posts: 2766
|
| Post: #50 Posted: Mon Jun 20, 2011 11:16 pm Post subject: |
|
|
LIC future closed below 55 SMA low --which is 219.60-- it closed at 218.20-- 55 sma close is 223-- so if tom it dosent cross 223-- then day after its a short with 55 SMA high Stop loss
If i am wrong please correct-- VKMKC-- please dont get annoyed as u got in Jchart things
|
|
| Back to top |
|
|
vkmkc
White Belt
Joined: 14 Jun 2011
Posts: 59
|
| Post: #51 Posted: Mon Jun 20, 2011 11:17 pm Post subject: |
|
|
| Rahulsharmaat wrote: | LIC future closed below 55 SMA low --which is 219.60-- it closed at 218.20-- 55 sma close is 223-- so if tom it dosent cross 223-- then day after its a short with 55 SMA high Stop loss
If i am wrong please correct-- VKMKC-- please dont get annoyed as u got in Jchart things |
Please forgive me, deep regret   
|
|
| Back to top |
|
|
acharyams
Yellow Belt

Joined: 04 Jul 2010
Posts: 552
|
| Post: #52 Posted: Mon Jun 20, 2011 11:20 pm Post subject: Re: too much |
|
|
sir,
you said, "your ultimate stop loss is low sma of 55".
Question is "is the stop loss on CLOSING BASIS?"
|
|
| Back to top |
|
|
chiragbvyas
White Belt
Joined: 18 Feb 2010
Posts: 469
|
| Post: #53 Posted: Mon Jun 20, 2011 11:21 pm Post subject: jcharts |
|
|
vkmkc,
just open www.icharts.in , then login left hand side you will find home, services offered in that column there is Jcharts(eod) click on that, by default nifty chart will open, and one 30 days sma is selected simply change the value to 55 that is 55 days close sma. got it ?
|
|
| Back to top |
|
|
ronypan
White Belt
Joined: 07 Aug 2010
Posts: 197
|
| Post: #54 Posted: Mon Jun 20, 2011 11:24 pm Post subject: |
|
|
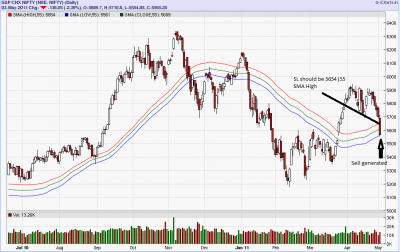
I think It should be like this.. Isn't it???
| Description: |
|
| Filesize: |
61.19 KB |
| Viewed: |
593 Time(s) |
|
|
|
| Back to top |
|
|
chiragbvyas
White Belt
Joined: 18 Feb 2010
Posts: 469
|
| Post: #55 Posted: Mon Jun 20, 2011 11:24 pm Post subject: good |
|
|
acharyams
if you could maintain it to closing base then it's best coz sometimes scripts goes below it and close above close 55 sma and next day opens in gap so if u use that stop loss as closing base that is much better.
|
|
| Back to top |
|
|
adsingh101
White Belt
Joined: 09 Nov 2010
Posts: 242
|
| Post: #56 Posted: Mon Jun 20, 2011 11:25 pm Post subject: |
|
|
| Bharti AIrtel, NTPC,RELCAPITAL, ITC, BOMBAYDYIENG all there shares are coming in the radar of this theory.
|
|
| Back to top |
|
|
vkmkc
White Belt
Joined: 14 Jun 2011
Posts: 59
|
| Post: #57 Posted: Mon Jun 20, 2011 11:27 pm Post subject: Re: jcharts |
|
|
| chiragbvyas wrote: | vkmkc,
just open www.icharts.in , then login left hand side you will find home, services offered in that column there is Jcharts(eod) click on that, by default nifty chart will open, and one 30 days sma is selected simply change the value to 55 that is 55 days close sma. got it ? |
[b]Appreciate, i have done that but as i change the stock , it gets changed to 30[/b]
|
|
| Back to top |
|
|
chiragbvyas
White Belt
Joined: 18 Feb 2010
Posts: 469
|
| Post: #58 Posted: Mon Jun 20, 2011 11:28 pm Post subject: enter |
|
|
| after placing 55 in place of 30 just press enter.
|
|
| Back to top |
|
|
Rahulsharmaat
Black Belt
Joined: 04 Nov 2009
Posts: 2766
|
| Post: #59 Posted: Mon Jun 20, 2011 11:29 pm Post subject: |
|
|
| U need to write 55 and press enter key-- it will be there permanent
|
|
| Back to top |
|
|
vkmkc
White Belt
Joined: 14 Jun 2011
Posts: 59
|
| Post: #60 Posted: Mon Jun 20, 2011 11:33 pm Post subject: |
|
|
| Rahulsharmaat wrote: | | U need to write 55 and press enter key-- it will be there permanent |
No sir, each & every time u need to put 55
|
|
| Back to top |
|
|
|


