| View previous topic :: View next topic |
| Author |
For Chirag-20/35/55 sma study for nifty |
vkmkc
White Belt

Joined: 14 Jun 2011
Posts: 59
|
Post: #61  Posted: Mon Jun 20, 2011 11:35 pm Post subject: Posted: Mon Jun 20, 2011 11:35 pm Post subject: |
 |
|
| adsingh101 wrote: | | Bharti AIrtel, NTPC,RELCAPITAL, ITC, BOMBAYDYIENG all there shares are coming in the radar of this theory. |
How did u find that, let us know?
|
|
| Back to top |
|
 |
|
|
 |
Rahulsharmaat
Black Belt

Joined: 04 Nov 2009
Posts: 2766
|
Post: #62  Posted: Mon Jun 20, 2011 11:35 pm Post subject: Posted: Mon Jun 20, 2011 11:35 pm Post subject: |
 |
|
| I dont have to-- i checked 200 stocks today -- that too after pressing once-- its saved there
|
|
| Back to top |
|
 |
vkmkc
White Belt

Joined: 14 Jun 2011
Posts: 59
|
Post: #63  Posted: Mon Jun 20, 2011 11:40 pm Post subject: Posted: Mon Jun 20, 2011 11:40 pm Post subject: |
 |
|
| Rahulsharmaat wrote: | | I dont have to-- i checked 200 stocks today -- that too after pressing once-- its saved there |
In JCharts[EOD], really,
|
|
| Back to top |
|
 |
vkmkc
White Belt

Joined: 14 Jun 2011
Posts: 59
|
Post: #64  Posted: Mon Jun 20, 2011 11:53 pm Post subject: Posted: Mon Jun 20, 2011 11:53 pm Post subject: |
 |
|
| Rahulsharmaat wrote: | | I dont have to-- i checked 200 stocks today -- that too after pressing once-- its saved there |
Buddy i am not able to do that
|
|
| Back to top |
|
 |
drsureshbs
White Belt

Joined: 22 Oct 2008
Posts: 58
|
Post: #65  Posted: Tue Jun 21, 2011 12:54 am Post subject: Posted: Tue Jun 21, 2011 12:54 am Post subject: |
 |
|
| vkmkc wrote: | | Rahulsharmaat wrote: | | I dont have to-- i checked 200 stocks today -- that too after pressing once-- its saved there |
[
b]In JCharts[EOD], really, [/b] |
Afterwriting sma value just save it using option in leftside lower corner of iteractive charts
|
|
| Back to top |
|
 |
hemzbond
White Belt

Joined: 21 Jul 2009
Posts: 30
|
Post: #66  Posted: Tue Jun 21, 2011 3:16 am Post subject: Posted: Tue Jun 21, 2011 3:16 am Post subject: |
 |
|
[img]
thx chirag
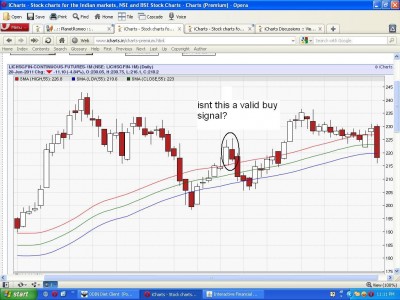
for ur valuable inputs. i was going thru the charts of LIC HOUSING FINANCE and noticed what looked like a false buy signal i hv encircled it for ur reference. pl let me know what is it i m missing out on[/img]
| Description: |
|
| Filesize: |
130.21 KB |
| Viewed: |
462 Time(s) |

|
|
|
| Back to top |
|
 |
hemzbond
White Belt

Joined: 21 Jul 2009
Posts: 30
|
Post: #67  Posted: Tue Jun 21, 2011 3:37 am Post subject: can u pl tell me what is it i m missing Posted: Tue Jun 21, 2011 3:37 am Post subject: can u pl tell me what is it i m missing |
 |
|
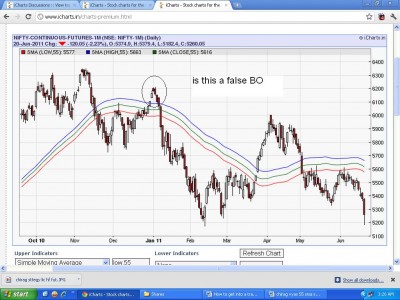
hey buddy it seems like i m missing out on something. pl . guide
in the chart below, in the month of jan, the mkt reverses soon after giving a buy signal ? or is it not a valid buy signal .
if its a whipsaw what should be done to minimise losses
| Description: |
|
| Filesize: |
128.25 KB |
| Viewed: |
490 Time(s) |

|
|
|
| Back to top |
|
 |
acharyams
Yellow Belt

Joined: 04 Jul 2010
Posts: 552
|
Post: #68  Posted: Tue Jun 21, 2011 7:47 am Post subject: Re: can u pl tell me what is it i m missing Posted: Tue Jun 21, 2011 7:47 am Post subject: Re: can u pl tell me what is it i m missing |
 |
|
Is there any easy way to find out which stocks have closed above 55 high sma after day's trading?
PLEASE GUIDE
|
|
| Back to top |
|
 |
chiragbvyas
White Belt

Joined: 18 Feb 2010
Posts: 469
|
Post: #69  Posted: Tue Jun 21, 2011 8:29 am Post subject: good work Posted: Tue Jun 21, 2011 8:29 am Post subject: good work |
 |
|
Mr. bond,
nice work, where you have circled the chart it mentions that stop loss has been taken. but very next you have chance to short. in chart of lic the first candle itself has closed above 55 high sma and u could have good bull run where u have made circle that is stop loss is taken but after few days you have good break out and our both conditions are fulfilled. To avoid false break out and not to be trapped we recommend tight stop loss policy.
|
|
| Back to top |
|
 |
chiragbvyas
White Belt

Joined: 18 Feb 2010
Posts: 469
|
Post: #70  Posted: Tue Jun 21, 2011 8:32 am Post subject: no way Posted: Tue Jun 21, 2011 8:32 am Post subject: no way |
 |
|
acharyams,
there is no any other way i know to find the scripts which are running around 55 days sma.
you have to find out yourself. or keep searching on net, may be you get any website. keep trying.
|
|
| Back to top |
|
 |
chiragbvyas
White Belt

Joined: 18 Feb 2010
Posts: 469
|
Post: #71  Posted: Tue Jun 21, 2011 8:35 am Post subject: one minute Posted: Tue Jun 21, 2011 8:35 am Post subject: one minute |
 |
|
| you can start a thread that asks our friends of icharts to post their details or they can help you to find out scripts running near 50 or 55 days sma. i think this could work.
|
|
| Back to top |
|
 |
vkmkc
White Belt

Joined: 14 Jun 2011
Posts: 59
|
Post: #72  Posted: Tue Jun 21, 2011 9:27 am Post subject: Re: one minute Posted: Tue Jun 21, 2011 9:27 am Post subject: Re: one minute |
 |
|
| chiragbvyas wrote: | | you can start a thread that asks our friends of icharts to post their details or they can help you to find out scripts running near 50 or 55 days sma. i think this could work. |
Hey, it can be found @Screener[EOD]----- Price Moved[50]
|
|
| Back to top |
|
 |
chiragbvyas
White Belt

Joined: 18 Feb 2010
Posts: 469
|
Post: #73  Posted: Tue Jun 21, 2011 9:57 am Post subject: good Posted: Tue Jun 21, 2011 9:57 am Post subject: good |
 |
|
| well done.
|
|
| Back to top |
|
 |
vkmkc
White Belt

Joined: 14 Jun 2011
Posts: 59
|
Post: #74  Posted: Tue Jun 21, 2011 10:18 am Post subject: Re: good Posted: Tue Jun 21, 2011 10:18 am Post subject: Re: good |
 |
|
| chiragbvyas wrote: | | well done. |
Thanks & Appreciate    . .
TTML & CANFINHOM is on the burn of SMA 55
|
|
| Back to top |
|
 |
acharyams
Yellow Belt

Joined: 04 Jul 2010
Posts: 552
|
Post: #75  Posted: Tue Jun 21, 2011 11:17 am Post subject: Re: good Posted: Tue Jun 21, 2011 11:17 am Post subject: Re: good |
 |
|
| can anybody provide yesterday's 55 sma breakout stock list for the benefit of the whole forum members?
|
|
| Back to top |
|
 |
|

