| View previous topic :: View next topic |
| Author |
For Chirag-20/35/55 sma study for nifty |
vinay28
Black Belt

Joined: 24 Dec 2010
Posts: 11748
|
Post: #1  Posted: Sat Jun 18, 2011 7:58 pm Post subject: For Chirag-20/35/55 sma study for nifty Posted: Sat Jun 18, 2011 7:58 pm Post subject: For Chirag-20/35/55 sma study for nifty |
 |
|
Dear Chirag
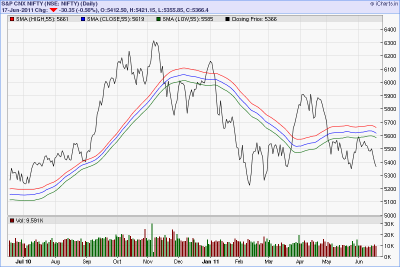
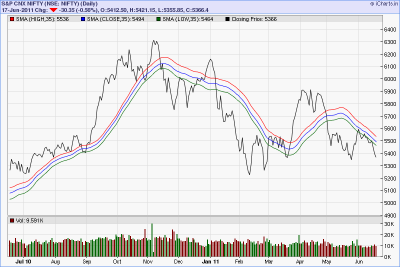
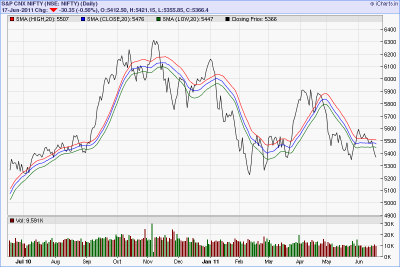
Based on our chat and in order to understand better, I tried to compare 20, 35 (since I have seen a lot of people taliking about this figure) and 55 sma charts for nifty over one year period and I am attaching them.
1. It appears that 20 sma basis gives earlier indication to get out and hence more % profit but can become too frequent and frustrating. 55 sma basis, on the other hand, gives lesser % profit but is safer and less frequent, which also means less tension and more time to relax. However, 35 sma basis seems to give best of both i.e. optimum.
2. While, as you said, SL makes you safe, how does one decide when to book profit?
Your comments on both issues please.
Thanks
Vinay
| Description: |
|
| Filesize: |
62.63 KB |
| Viewed: |
1246 Time(s) |
|
| Description: |
|
| Filesize: |
63.94 KB |
| Viewed: |
967 Time(s) |
|
| Description: |
|
| Filesize: |
65.48 KB |
| Viewed: |
911 Time(s) |
|
|
|
| Back to top |
|
 |
|
|
|
chiragbvyas
White Belt

Joined: 18 Feb 2010
Posts: 469
|
| Post: #2 Posted: Sat Jun 18, 2011 11:33 pm Post subject: well done |
|
|
i appreciate your work. now compare all the three charts. highest whipsaws are in 20 day sma. and lowest in 55.
1. you get buy entry in sept. around and stoploss hit at around 6000.
2. mid november you have chance to short but stoploss hit around same price.
3. mid january you can short around 5975 and stoploss hit at 5600.
4.march end initiate buy around 5600 but stoploss hit at 5650
5.currently sell initiated at 5650 and stoploss is 5661 let us see what happens will it take our sl first or declines more. all prices mentioned are not exact but after viewing yr chart it's only overview.
rest 20 and 34, we dont track other than 55 days sma but i have seen your charts. we dont run after the prices, we want prices to chase us to hit our stoploss coz we do not close our position at market price but only by stop loss. and the matter when t book profit? depends on his/her risk reward ratio.
|
|
| Back to top |
|
|
chiragbvyas
White Belt
Joined: 18 Feb 2010
Posts: 469
|
| Post: #3 Posted: Sun Jun 19, 2011 10:40 am Post subject: all together |
|
|
put the values in ichrt (premium) close,20 close,35 and close,55 all together and see the power of 55 i think the point is cleared. if you use shorter sma's there will be more whipsaws, if you could have the chance to earn good profit, but you can not gain the confidence that it will actually happen, stoploss may be taken out coz of whipsaws. longer sma's , if you use you willl not get frequent entries and exits, so better is to use mid time frame sma that have both the benefits.
got the point ? for any confusion or doubts you are welcome.
|
|
| Back to top |
|
|
vinay28
Black Belt
Joined: 24 Dec 2010
Posts: 11748
|
| Post: #4 Posted: Sun Jun 19, 2011 12:28 pm Post subject: |
|
|
Dear Chirag
Many thanks.
1. What you have stated became clearer not as much by your discussion on chart with different SMAs as by the fact that you said that you book profit only by SL. When one buys, SL keeps going up if market/scrip keeps going up. Clearly a higher sma value will give more success. Right?
2. What is basis of selecting 55? Is it because it is a Fibonecci no.?
3. Clearly there are other methods which can trigger a buy/sell? I am asking this because I found that scrips recommended by experts on TV don't show buy/sell by this method.
|
|
| Back to top |
|
|
chiragbvyas
White Belt
Joined: 18 Feb 2010
Posts: 469
|
| Post: #5 Posted: Sun Jun 19, 2011 6:46 pm Post subject: that's true |
|
|
see whenever markets correct the first sign of recovery seen in the sma of 3 days or 5 days. then some time later it crosses 13 days then comes around 20 days or 34 days if the script is going to decline again then it would go down from here most probably. if it don't decline and an up move is continue than it will cross 50 days. now if fifty day sma is running below 200 days sma then cahnces are it will roughly makes high above 50 day high sma but in many cases do nor cross 55 days high sma and declines more and speedy from here.
one more thing if 50 days crosses 200 days sma it is called GOLDEN CROSS.
if it happens then that script could have been crossed and closed above 55 days sma and my set up is ready for trade. so 55 days sma is gateway for big bull run or speedy crash.
so i prefer 55 days sma, it is also a fibo number.
|
|
| Back to top |
|
|
chiragbvyas
White Belt
Joined: 18 Feb 2010
Posts: 469
|
| Post: #6 Posted: Sun Jun 19, 2011 6:54 pm Post subject: Mr. Veerappan. |
|
|
i hope this discussion should end here because most of the doubts and confusions are cleared, regarding 55 days sma. if any doubt is there u r most welcome.
I WOULD LIKE TO KNOW Mr. VIRAPPAN'S VIEW ON THIS WHOLE DISCUSSION ON MY STRATEGY, IF THERE IS ANY WEAK POINT OR ANYTHING IF I AM MISSING.
|
|
| Back to top |
|
|
vinay28
Black Belt
Joined: 24 Dec 2010
Posts: 11748
|
| Post: #7 Posted: Sun Jun 19, 2011 7:42 pm Post subject: |
|
|
| Thanks Chirag
|
|
| Back to top |
|
|
chiragbvyas
White Belt
Joined: 18 Feb 2010
Posts: 469
|
| Post: #8 Posted: Sun Jun 19, 2011 9:58 pm Post subject: welcome |
|
|
| you are welcome. hope you will benefit using any sma.
|
|
| Back to top |
|
|
Rahulsharmaat
Black Belt
Joined: 04 Nov 2009
Posts: 2766
|
| Post: #9 Posted: Sun Jun 19, 2011 11:01 pm Post subject: |
|
|
chirag-- its greattttttttttttttttttttttttttttttttt
Patel Eng was short at 400 and went till 130--- that what u meant when u said wait till Sl hits---
|
|
| Back to top |
|
|
chiragbvyas
White Belt
Joined: 18 Feb 2010
Posts: 469
|
| Post: #10 Posted: Mon Jun 20, 2011 6:53 am Post subject: good |
|
|
| that's exactly what i mean by square up position only by stop loss. In this system of 55 days simple moving avg STOP LOSS IS OUR GOD, rest all we do not count. now patel eng closes above 161.3 your stoploss is 153 (closing base) target could be anything up to 400. wait till your stop loss taken.
|
|
| Back to top |
|
|
veerappan
Expert

Joined: 19 Dec 2007
Posts: 3680
|
| Post: #11 Posted: Mon Jun 20, 2011 7:01 am Post subject: |
|
|
jee-rock.... 
|
|
| Back to top |
|
|
chiragbvyas
White Belt
Joined: 18 Feb 2010
Posts: 469
|
| Post: #12 Posted: Mon Jun 20, 2011 8:41 am Post subject: thanks |
|
|
| Thanks Mr. Veerappan for raising my spirit.
|
|
| Back to top |
|
|
ragarwal
Yellow Belt

Joined: 16 Nov 2008
Posts: 582
|
| Post: #13 Posted: Mon Jun 20, 2011 8:56 am Post subject: |
|
|
dear veeru dada plz post ur comments on copper,nickel silver n crude.
regds rashmi
|
|
| Back to top |
|
|
prabit
White Belt
Joined: 02 Jul 2009
Posts: 133
|
| Post: #14 Posted: Mon Jun 20, 2011 11:49 am Post subject: |
|
|
| THANKS Veeru Guru for the wisdom and Chirag for the set up.
|
|
| Back to top |
|
|
chiragbvyas
White Belt
Joined: 18 Feb 2010
Posts: 469
|
| Post: #15 Posted: Mon Jun 20, 2011 1:43 pm Post subject: no need to thanking me |
|
|
| no need to thanking me, we are all same thirsty technical traders, just use this set up and make handsome profits from the markets.
|
|
| Back to top |
|
|
|


