| View previous topic :: View next topic |
| Author |
Gann Angle-Nifty Future |
chandrujimrc
Brown Belt

Joined: 21 Apr 2009
Posts: 1683
|
Post: #16  Posted: Fri May 10, 2013 6:06 pm Post subject: Posted: Fri May 10, 2013 6:06 pm Post subject: |
 |
|
Dear Dutt,
Thanks for your gann angle calculator.If you don"t mind,pl change the violet colour with suitable some other colour.So we van view very clearly.
|
|
| Back to top |
|
 |
|
|
|
Dutt
White Belt

Joined: 01 Nov 2010
Posts: 118
|
| Post: #17 Posted: Fri May 10, 2013 10:58 pm Post subject: |
|
|
Dear Chandru,
You can change the colours to any suitable colour you like by selecting the rows that you want to change.
Thanks
Aloakdutt
|
|
| Back to top |
|
|
ajit602
White Belt
Joined: 11 Sep 2012
Posts: 370
|
| Post: #18 Posted: Fri May 10, 2013 11:09 pm Post subject: information |
|
|
| Dutt wrote: | Dear Forum Members,
I have uploaded the gann sq9 and gann angle sheet for benefit of all.
In case the buy sell difference below 5 points then use midpoint of high low.
In noway this should be sold to anyone, this is a free distribution to forum members.
Thanks
Aloakdutt |
please tell how to use this calclator
|
|
| Back to top |
|
|
Dutt
White Belt
Joined: 01 Nov 2010
Posts: 118
|
| Post: #19 Posted: Fri May 10, 2013 11:26 pm Post subject: |
|
|
Dear Ajit,
Take the first 15 Min Candle High and Low @ 09:30, as Market starts at 09:15. Wait for the candle to complete @ 09:30 .
Kindly input the high price next to column where i have written High and low price in below the word Low. Incase sell price is higher than buy or less than 5 points difference . then take the mid point price and incorporate it both in high and low and you will get signals & tgts showing in the sheet. Buy & Sell Entry is at 15 degree you can keep stoploss at 7.5 or 3.5 degree based oon your risk.
Incase you need further clarification you can pm me or leave a msg will get back to you.
Thanks and Regards
Aloakdutt
|
|
| Back to top |
|
|
Dutt
White Belt
Joined: 01 Nov 2010
Posts: 118
|
| Post: #20 Posted: Fri May 10, 2013 11:28 pm Post subject: |
|
|
| The sheet can be used for Stock options, Index options, cash , futures currency Gold, SIlver . anything , it is all in one.
|
|
| Back to top |
|
|
ajit602
White Belt
Joined: 11 Sep 2012
Posts: 370
|
| Post: #21 Posted: Fri May 10, 2013 11:54 pm Post subject: |
|
|
[quote="Dutt"]Dear Ajit,
Take the first 15 Min Candle High and Low @ 09:30, as Market starts at 09:15. Wait for the candle to complete @ 09:30 .
Kindly input the high price next to column where i have written High and low price in below the word Low. Incase sell price is higher than buy or less than 5 points difference . then take the mid point price and incorporate it both in high and low and you will get signals & tgts showing in the sheet. Buy & Sell Entry is at 15 degree you can keep stoploss at 7.5 or 3.5 degree based oon your risk.
Incase you need further clarification you can pm me or leave a msg will get back to you.
dutt sir,
thanks you very much,
|
|
| Back to top |
|
|
saumya12
Brown Belt
Joined: 21 Dec 2011
Posts: 1509
|
| Post: #22 Posted: Sun May 12, 2013 12:59 pm Post subject: |
|
|
| Dutt wrote: |
Take the first 15 Min Candle High and Low @ 09:30, as Market starts at 09:15. Wait for the candle to complete @ 09:30 .
Kindly input the high price next to column where i have written High and low price in below the word Low. Incase sell price is higher than buy or less than 5 points difference . then take the mid point price and incorporate it both in high and low and you will get signals & tgts showing in the sheet. Buy & Sell Entry is at 15 degree you can keep stoploss at 7.5 or 3.5 degree based oon your risk.
Incase you need further clarification you can pm me or leave a msg will get back to you.
Thanks and Regards
Aloakdutt |
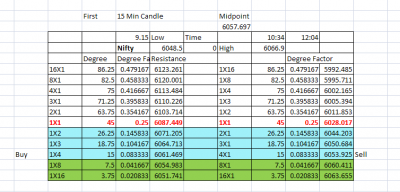
Many thanks to you, Alok for the Gann Angle Excel Calculation Sheet and the procedure.
I am attaching a calculation based on 10.5.13 9.30 High-Low.
Now the buy as per sheet is 6061.5 and sell is 6053.9 (say 6054).
And let us suppose this sell value to be > 6057 instead of 6054 (considering that sell price is higher than buy or less than 5 points difference) then we will take value mentioned below midpoint, as high and low values and calculate again for buy and sell values.
Please correct me if I have mistaken somewhere.
Thanks
| Description: |
|
| Filesize: |
25.35 KB |
| Viewed: |
1746 Time(s) |
|
|
|
| Back to top |
|
|
pkholla
Black Belt

Joined: 04 Nov 2010
Posts: 2890
|
| Post: #23 Posted: Sun May 12, 2013 3:57 pm Post subject: |
|
|
| Dutt wrote: | | Dear Forum Members, I have uploaded the gann sq9 and gann angle sheet for benefit of all. In case the buy sell difference below 5 points then use midpoint of high low. In noway this should be sold to anyone, this is a free distribution to forum members. Thanks Aloakdutt |
Alok: Can you quickly FILE, SAVE AS, save as old version, get same file as .xls ending and post for benefit of members like me who prefer old version of Excel and CANNOT open .xlsx file? Cheers, Prakash Holla
|
|
| Back to top |
|
|
vinay28
Black Belt
Joined: 24 Dec 2010
Posts: 11748
|
| Post: #24 Posted: Sun May 12, 2013 4:09 pm Post subject: |
|
|
| I have one doubt. Are the two sheets in the file related? And if yes, how?
|
|
| Back to top |
|
|
Dutt
White Belt
Joined: 01 Nov 2010
Posts: 118
|
| Post: #25 Posted: Sun May 12, 2013 11:11 pm Post subject: |
|
|
Dear Vinay,
Both sheets are different one works on Gann sq of nine and another is entirely different as gann angle
Thanks
Aloakdutt
|
|
| Back to top |
|
|
Dutt
White Belt
Joined: 01 Nov 2010
Posts: 118
|
| Post: #26 Posted: Sun May 12, 2013 11:15 pm Post subject: |
|
|
Dear Pholla,
Please find the attached excel sheet of gann angle in old version as requested
Thanks
Aloakdutt
| Description: |
|

Download |
| Filename: |
Gann Angle Excel old version.xls |
| Filesize: |
28.5 KB |
| Downloaded: |
1643 Time(s) |
|
|
| Back to top |
|
|
Dutt
White Belt
Joined: 01 Nov 2010
Posts: 118
|
| Post: #27 Posted: Sun May 12, 2013 11:22 pm Post subject: |
|
|
Dear Saumya,
You are right, you need to take midpoint value and input them in high and low column to get buy sell levels.
Incase sell value is greater than buy value or there is a difference of less than 5 points.
Hope your questions are answered.
Thanks
Aloakdutt
|
|
| Back to top |
|
|
pkholla
Black Belt
Joined: 04 Nov 2010
Posts: 2890
|
| Post: #28 Posted: Mon May 13, 2013 9:29 am Post subject: |
|
|
| Dutt wrote: | | Dear Pholla, Please find the attached excel sheet of gann angle in old version as requested Thanks Aloakdutt |
I should say thanks not you!
Thanks for the file, Prakash Holla
|
|
| Back to top |
|
|
saumya12
Brown Belt
Joined: 21 Dec 2011
Posts: 1509
|
| Post: #29 Posted: Mon May 13, 2013 10:51 am Post subject: |
|
|
| Dutt wrote: | Dear Saumya,
You are right, you need to take midpoint value and input them in high and low column to get buy sell levels.
Incase sell value is greater than buy value or there is a difference of less than 5 points.
Hope your questions are answered.
Thanks
Aloakdutt |
Thanks Alok
|
|
| Back to top |
|
|
Dutt
White Belt
Joined: 01 Nov 2010
Posts: 118
|
| Post: #30 Posted: Mon May 13, 2013 12:43 pm Post subject: |
|
|
Gann Angle for 13/05/2013. Today i was late as i had gone to drop my friend to office.
Today sell value was more than buy value hence taken midpoint of high and low values.

Thanks
Aloakdutt
|
|
| Back to top |
|
|
|


